


Chinese Americans are Americans of Chinese ancestry. Chinese Americans constitute a subgroup of East Asian Americans which also constitute a subgroup of Asian Americans. Many Chinese Americans have ancestors from mainland China, Hong Kong, Macau, Malaysia, Singapore, Taiwan,[4] as well as other regions that are inhabited by large populations of the Chinese diaspora, especially Southeast Asia and some other countries such as Australia, Canada, France, South Africa, New Zealand, and the United Kingdom. Chinese Americans include Chinese from the China circle and around the world who became naturalized U.S. citizens as well as their natural-born descendants in the United States.
The Chinese American community is the largest overseas Chinese community outside Asia. It is also the third-largest community in the Chinese diaspora, behind the Chinese communities in Thailand and Malaysia. The 2016 Community Survey of the U.S. Census estimated the population of Chinese Americans of one or more races to be 5,081,682.[5] According to the 2010 census, the Chinese American population numbered about 3.8 million.[6] In 2010, half of the Chinese-born people in the United States lived in California and New York.[7]
About half or more of the Chinese ethnic people in the U.S. in the 1980s had roots in Taishan, Guangdong,[8] a city in southern China near the major city of Guangzhou. In general, much of the Chinese population before the 1990s consisted of Cantonese or Taishanese-speaking people from southern China, predominately from Guangdong province. During the 1980s, more Mandarin-speaking immigrants from Northern China and Taiwan immigrated to the U.S.[9] The Chinese population in much of the 1800s and 1990s was almost entirely contained to the Western U.S., especially California and Nevada, as well as New York City. Originally, Chinese immigrants and their descendants generally[clarification needed] lived in Chinatowns (especially the ones in San Francisco and New York), or Chinese populated districts in downtowns of major cities.
History

There are three major waves of recent Chinese immigration into America:
- First wave, beginning in 1815, sailors and merchants from Sino-U.S. maritime trade
- Second wave, 1949-1980s, where WWII allyship led to the repealing of the Chinese Exclusion Act and the passing of the Magnuson Act, legally allowing for Chinese Americans to naturalize
- Third wave, 1980s-present, when the PRC removed restrictions on emigration from China

First wave (1815–1949)
19th century arrivals, cause for migration
Nearly all of the early Chinese migrants were young men from rural villages of Toisan, as well as the eight districts in Guangdong Province.[10] The Guangdong province, especially Toisan, experienced extreme floods and famine in the mid-nineteenth century, as well as mass political unrest such as the Red Turban unrest. This prompted many people to migrate to America.[11]
The vast majority of the 19th century Chinese immigrants to the U.S. came from a small area of eight districts on the west side of the Pearl River Delta in Guangdong province. The eight districts consist of three subgroups—the four districts of Sze Yup, the district of Chung Shan, and the three districts of Sam Yup—each subgroup speaking a distinct dialect of Cantonese. In the U.S., people from Sze Yup generally worked as laborers; Chung Shan people specialized in agriculture; and Sam Yup people worked as entrepreneurs.[12]
California Gold Rush, Central Pacific Railroad construction
In the 1850s, Chinese workers migrated to work in the California Gold Rush,[13][14][15][16] and also to do agricultural jobs and factory work, especially the garment industry.[11] Some became entrepreneurs. Chinese often settled in ethnic neighborhoods called Chinatowns. In 1852, there were 25,000 Chinese migrants in America.

From 1860 until 1869, the Central Pacific Railroad recruited large labor gangs, with many laborers on five-year contracts, to build on the Transcontinental Railroad. Chinese laborers built the majority of the difficult route through the Sierra Nevada mountains and across Nevada. By 1869, there were at least 100,000 ethnic Chinese in the United States.[17] By 1887, less than four hundred thousand Chinese entered the United States, concentrated in California.[18]
Chinese Exclusion Acts
The Burlingame-Seward Treaty of 1868 between the United States and Qing China supported Chinese migration,[11] but the Page Law of 1875 banned all female Chinese migrants from entering the United States. Upon arrival to the U.S. Chinese men and women were separated from each other as they awaited hearings on their immigration status, which often took weeks. During this time the women were subjected to lengthy questioning that focused on their family life and origins. Their responses were then cross examined with others from their village, and any discrepancies were used to justify denial of entry. The stress of being separated from family caused many women to fall ill while they waited for a hearing. Some even committed suicide as they feared being denied access to the country. Once they were approved and allowed into the country, Chinese women migrants faced additional challenges. Many were coerced into prostitution, with over 60% of the adult Chinese women living in California in 1870 working in the trade. Some women were lured to the U.S. with the promise of marriage only to become sex slaves, while others went to the U.S. in order to reunite with their families. Ninety percent of the Chinese women who immigrated to the U.S. between 1898 and 1908 did so to join a husband or father. By 1900, only 4,522 of the 89,837 (5%) Chinese migrants were women.
In 1880, the diplomat James B. Angell was appointed to negotiate a new treaty with Qing China. The resulting Angell Treaty of 1880 restricted Chinese immigration and banned the naturalization of Chinese migrants.
Two years later, the Chinese Exclusion Act of 1882 prohibited all Chinese from immigrating for 10 years, and required all Chinese people to carry identification. This was the first act to restrict immigration in American history. Then, six years later, the Scott Act of 1888 illegalized reentry to the United States after a visit to China, even for long-term legal residents.
In 1892, the Geary Act was passed to extend the Chinese Exclusion Act, and in 1902, the prohibition was expanded to cover Hawaii and the Philippines, despite the strong objections from the Chinese government and people.[11]
Only in 1898, as a result of the United States v. Wong Kim Ark Supreme Court decision, ethnic Chinese born in the United States become American citizens.
The Chinese Exclusion Acts remained part of the law until 1943. With relations already complicated by the Treaties of Wangxia and Tianjian, the increasingly harsh restrictions on Chinese immigration combined with the rising discrimination against Chinese living in the United States in the 1870s-early 1900s.[11]
Second Wave (1949–1980)
During and after World War II, severe immigration restrictions were eased as the United States allied with China against Japanese expansionism. Later reforms in the 1960s placed increasing value on family unification, allowing relatives of U.S. citizens to receive preference in immigration.
Third Wave (1980s–present)
As of 2023, illegal Chinese immigration to New York City has accelerated.[19]
Museums
There are a number of museums in the United States specifically focusing on and documenting the Chinese American experience, the most prominent being the Museum of Chinese in America in Manhattan's Chinatown, established in 1980; as well as others, including the Chinese American Museum in Los Angeles, the Chinese American Museum of Chicago, the Chinese Historical Society of America in San Francisco, and the Chinese American Museum in Washington, D.C.
Demographics
Population
The chart on the right shows the total number of ethnic Chinese in the United States since 1850.[20][21]
| Year | Pop. | ±% |
|---|---|---|
| 1850 | 758 | — |
| 1860 | 34,933 | +4508.6% |
| 1870 | 63,199 | +80.9% |
| 1880 | 105,465 | +66.9% |
| 1890 | 107,488 | +1.9% |
| 1900 | 89,863 | −16.4% |
| 1910 | 71,531 | −20.4% |
| 1920 | 61,639 | −13.8% |
| 1930 | 74,954 | +21.6% |
| 1940 | 77,504 | +3.4% |
| 1950 | 117,629 | +51.8% |
| 1960 | 237,292 | +101.7% |
| 1970 | 435,062 | +83.3% |
| 1980 | 806,040 | +85.3% |
| 1990 | 1,645,472 | +104.1% |
| 2000 | 2,432,585 | +47.8% |
| 2010 | 3,347,229 | +37.6% |
| 2019 | 5,400,000 | +61.3% |

States with the largest estimated Chinese American populations
The states with the largest estimated Chinese American populations, according to the 2010 Census, were California (1,253,100; 3.4%), New York (577,000; 3.0%), Texas (157,000; 0.6%), New Jersey (134,500; 1.5%), Massachusetts (123,000; 1.9%), Illinois (104,200; 0.8%), Washington (94,200; 1.4%), Pennsylvania (85,000; 0.7%), Maryland (69,400; 1.2%), Virginia (59,800; 0.7%), and Ohio (51,033; 0.5%). The state of Hawaii has the highest concentration of Chinese Americans at 4.0%, or 55,000 people.
Population centers of Chinese Americans
According to the 2012 Census estimates,[23] the three metropolitan areas with the largest Chinese American populations were the Greater New York Combined Statistical Area at 735,019 people, the San Jose-San Francisco-Oakland Combined Statistical Area at 629,243 people, and the Los Angeles Area Combined Statistical Area at about 566,968 people. New York City contains by far the highest ethnic Chinese population of any individual city outside Asia, estimated at 628,763 as of 2017.[24] The Los Angeles County city of Monterey Park has the highest percentage of Chinese Americans of any municipality, at 43.7% of its population, or 24,758 people.
The New York metropolitan area, which includes New York City, Long Island, and nearby areas within the states of New York, New Jersey, Connecticut, and Pennsylvania, is home to the largest Chinese American population of any metropolitan area within the United States, enumerating an estimated 893,697 in 2017[25] and including at least 12 Chinatowns. Continuing significant immigration from mainland China is fueled by New York's status as an alpha global city, its high population density, its extensive mass transit system, and the New York metropolitan area's enormous economic marketplace. The Manhattan Chinatown contains the largest concentration of ethnic Chinese in the Western hemisphere;[26] while the Flushing Chinatown in Queens has become the world's largest Chinatown. As of 2023, illegal Chinese immigration to New York City, and especially to the Flushing, Queens Chinatown, has accelerated.[19]
Also on the East Coast, Greater Boston and the Philadelphia metropolitan area are home to significant Chinese American communities, with Chinatowns in Boston and Philadelphia hosting important and diverse cultural centers. Significant populations can also be found in the Washington metropolitan area, with Montgomery County, Maryland and Fairfax County, Virginia, being 3.9% and 2.4% Chinese American, respectively. Boston's Chinatown is the only historical Chinese neighborhood within New England. The Boston suburb of Quincy also has a prominent Chinese American population, especially within the North Quincy area.[27]
San Francisco, California has the highest per capita concentration of Chinese Americans of any major city in the United States, at an estimated 21.4%, or 172,181 people, and contains the second-largest total number of Chinese Americans of any U.S. city. San Francisco's Chinatown was established in the 1840s, making it the oldest Chinatown in North America and one of the largest neighborhoods of Chinese people outside of Asia,[28][29] composed in large part by immigrants hailing from Guangdong province and also many from Hong Kong. The San Francisco neighborhoods of Sunset District and Richmond District also contain significant Chinese populations.
In addition to the big cities, smaller pockets of Chinese Americans are also dispersed in rural towns, often university-college towns, throughout the United States. For example, the number of Chinese Americans, including college professors, doctors, professionals, and students, has increased over 200% from 2005 to 2010 in Providence, Rhode Island, a small city with a large number of colleges.
Income and social status
Income and social status of these Chinese American locations vary widely. As of 2012 about 333,333 people living in the United States with a Chinese background are not United States citizens.[30] Although many Chinese Americans in Chinatowns of large cities are often members of an impoverished working class, others are well-educated upper-class people living in affluent suburbs. The upper and lower-class Chinese are also widely separated by social status and class discrimination. In California's San Gabriel Valley, for example, the cities of Monterey Park and San Marino are both Chinese American communities lying geographically close to each other but they are separated by a large socioeconomic gap.
Cultural centers

| Rank | City | State | Chinese Americans | Percentage |
|---|---|---|---|---|
| 1 | San Francisco | California | 172,181 | 21.4 |
| 2 | Honolulu | Hawaii | 38,330 | 10.2 |
| 3 | Oakland | California | 34,083 | 8.7 |
| 4 | San Jose | California | 63,434 | 6.7 |
| 5 | New York City | New York | 486,463 | 6.0 |
| 6 | Plano | Texas | 13,592 | 5.2 |
| 7 | Sacramento | California | 20,307 | 4.4 |
| 8 | Seattle | Washington | 27,216 | 4.1 |
| 9 | Boston | Massachusetts | 24,910 | 4.0 |
| 10 | San Diego | California | 35,661 | 2.7 |
| 11 | Philadelphia | Pennsylvania | 30,069 | 2.0 |
| 12 | Stockton | California | 5,188 | 1.8 |
| 13 | Los Angeles | California | 66,782 | 1.8 |
| 14 | Portland | Oregon | 9,113 | 1.7 |
| 15 | Chicago | Illinois | 43,228 | 1.6 |
| 16 | Anaheim | California | 4,738 | 1.4 |
| 17 | Houston | Texas | 29,429 | 1.3 |
| 18 | Austin | Texas | 8,886 | 1.2 |
| 19 | Pittsburgh | Pennsylvania | 3,402 | 1.1 |
| 20 | Riverside | California | 2,985 | 1.0 |
Social status and assimilation

Some noteworthy historical Chinese contributions to America include building the western half of the Transcontinental Railroad, the levees in the Sacramento River Delta, Chinese American food, deep oil extraction in Texas, and the introduction of Chinese and East Asian culture to America, such as Buddhism, Taoism, and Kung fu.
Chinese immigrants to the United States brought many of their ideas, values, and culture with them. Some of these have continued to influence later generations, such as the Confucian respect for elders.[42] Similarly, education and the civil service were the most important path for upward social mobility in China.[42][43] The first Broadway show about Asian Americans was Flower Drum Song which premiered on Broadway in 1958;[44] the hit Chinglish premiered on Broadway in 2011.[45]
In most American cities with significant Chinese populations, the Spring Festival (Chinese New Year) is celebrated with cultural festivals and other celebrations. In Seattle, the Chinese Culture and Arts Festival is held every year. Other important festivals include the Dragon Boat Festival and the Mid-Autumn Festival.
Discrimination, prejudice, depression and suicide


Perceptions and stereotypes
A 2007 analysis indicated that most non-Asian Americans do not differentiate between Chinese Americans and East Asian Americans generally, and perceptions of both groups are nearly identical.[46] A 2001 survey of Americans' attitudes toward Asian Americans and Chinese Americans indicated that one fourth of the respondents had somewhat or very negative attitude toward Chinese Americans in general.[47] However, the study did also find several positive perceptions of Chinese Americans: strong family values (91%); honesty as entrepreneurs (77%); high value on education (67%).[46]
Anti-Chinese violence in the United States
Early Chinese Americans struggled to survive in the United States because of prejudice, discrimination, and violence.
In 1880, motivated by yellow peril and sensationalism surrounding the upcoming presidential election, a mob numbering 3,000 instigated an anti-Chinese riot in Denver, Colorado. A man named Look Young was lynched, and nearly all of Chinatown was destroyed. 185 Chinese men were held in jail for three days for their own safety. Most of the rioters arrested were dismissed, and the alleged murderers of Look Young were tried and found not guilty.[48][49]
In 1871, 17–20 Chinese immigrants were murdered in Los Angeles by a mob of around 500 men. This racially motivated massacre was one of the largest mass-lynchings in the United States, and it took place after the accidental killing of Robert Thompson, a local rancher.
The Rock Springs massacre occurred in 1885, in which at least 28 Chinese immigrants were killed and 15 other Chinese were injured. Many enraged white miners in Sweetwater County felt threatened by the Chinese and they also blamed them for their unemployment. As a result of competition for jobs, white miners expressed their frustration by committing acts of physical violence in which they robbed, shot, and stabbed Chinese in Chinatown. The Chinese quickly tried to flee, but in doing so, many of them ended up being burned alive in their homes, starving to death in hiding places, or being exposed to animal predators which lived in the mountains; some of them were successfully rescued by a passing train. A total of 78 homes were burned.
During the Hells Canyon massacre of 1887, at least 34 Chinese miners were killed. An accurate account of the event is still unavailable, but it is speculated that the Chinese miners were killed by gunshot during a robbery by a gang of seven armed horse thieves.
Other acts of violence which were committed against Chinese immigrants include the San Francisco riot of 1877, the Issaquah and Tacoma riot of 1885, the attack on Squak Valley Chinese laborers in 1885, the Seattle riot of 1886, and the Pacific Coast race riots of 1907. With the spread of the COVID-19 pandemic, which is believed to have started in the city of Wuhan, China, numerous incidents of xenophobia and racism against Chinese people and people who are perceived to be Chinese have been reported.
Depression and suicide
In 2008, researchers Georg Hsu and Yu Mui Wan published a paper citing severe stigma of mental illness in the Chinese American community as a barrier to diagnosis and treatment.[50] In a 1998 study of 29 diagnosed depressive Chinese American immigrants, more than half of respondents avoided labeling their symptoms as depression.[51] While patients were able to accurately identify and report depressive symptoms such as "irritability" and "rumination," patients were more likely to attribute their depression to somatic and physical symptoms than as a psychological state.[51]
Among Asian-American youth in 1980, suicide accounted for 20.8% of Chinese American female deaths.[52] Among males, it constituted 15.1% of deaths.[52] The study also reported that suicide rates among Chinese American elderly were higher than that of the national suicide rate for African-American, Hispanic, and Native-American.
A study published in the Journal of Aging and Health, stated that 18% to 29.4% of older Chinese adults in North America had at least a mild level of depression which was higher than other ethnic groups.[53] Further, the study reported that these depressive symptoms among older Chinese adults "tend to remain untreated."[53]
Languages
According to the United States Census Bureau, the various varieties of Chinese make up the third-most spoken language in the United States. It is almost completely spoken within Chinese American populations and by immigrants or the descendants of immigrants, especially in California.[54] In 2002, over 2 million Americans speak some variety or dialect of Chinese, with Standard Chinese (Mandarin) becoming increasingly common due to new immigration from China and supplanting the previous widespread Cantonese and Taishanese.[54]
In New York City, although Standard Chinese (Mandarin) was spoken as a native language among only 10% of American-born Chinese speakers, it is used as a secondary dialect to English.[55] In addition, the immigration from Fuzhou, Fujian brings in a significant[quantify] populace of Fuzhou people (Eastern Min), particularly Changle dialect speakers to major cities like New York City, San Francisco, and Boston.[citation needed] People from Fujian (Minnan region), Chaoshan, Taiwan and Southeast Asia mainly use Southern Min dialect (Hokkien and Teochew) as their mother tongue. Varieties of Wu Chinese, particularly Shanghainese and the mutually unintelligible Wenzhounese, are spoken by a minority of recent Chinese immigrants hailing from Jiangsu, Zhejiang, and Shanghai.[when?][citation needed]
Although many Chinese Americans grow up learning English, some teach their children to speak Chinese for a variety of reasons: preservation of an ancient civilization, preservation of a group identity, preservation of their cultural ancestry, desire for easy communication with each other and their relatives, and the perception that Chinese is a very useful language. The official standard for United States public notices and signage is Traditional Chinese.[56]
Religion
The majority of Chinese Americans do not report a religious affiliation. 43% of Chinese Americans switched to a different religion and 54% stayed within their childhood religion within their lifetime. According to the 2012 Pew Research Center Asian-American Survey, 52% of Chinese Americans aged 15 and over said that they did not have any religious affiliation. This is also compared with the religious affiliation of Asian-American average of 26% and a national average of 19%.
Of the survey respondents, 15% were Buddhist, 8% were Catholic, and 22% belonged to a Protestant denomination. About half of Chinese Americans (52%)—including 55% of those born in the U.S. and 51% of those born overseas—describe themselves as religiously unaffiliated.[3][57]
There are also many Chinese people in New York City who identify as Jewish due to intermarriage with Jews.[58][59] Some posit that Judaism has similar habits to Confucianism[60] such as the emphasis on scholarship.[speculation?]
There is a significantly higher[quantify] percentage of Chinese Christians in the United States than there is in China, as Chinese Christians flee to the United States from Chinese Communist persecution.[61][62]
List of Chinese temples in the United States
- Temple of Kwan Tai (武帝廟), located in Mendocino, California
- Bok Kai Temple (北溪廟), located in the city of Marysville, California
- Kong Chow Temple (岡州古廟), located in San Francisco, California
- Tin How Temple (天后古廟), located in San Francisco's Chinatown, California
- Oroville Chinese Temple (列聖宮), located in Oroville, California
- Ma-Tsu Temple (美國舊金山媽祖廟朝聖宮), located in San Francisco's Chinatown, California
- Weaverville Joss House (雲林廟), located in the center of the town of Weaverville, California
- Pao Fa Temple (寶法寺), located in Irvine, California
- Hsu Yun Temple (虛雲禪寺), located in Honolulu, Hawaii
- Hsi Lai Temple (佛光山西來寺), located in northern Puente Hills, Hacienda Heights, California
- City of Ten Thousand Buddhas (萬佛聖城), located in Talmage, California
- Chuang Yen Monastery (莊嚴寺), located in Kent, Putnam County, New York
Politics

Chinese Americans are divided among many subgroups based on factors such as language, religion, generational status, age and socioeconomic status. Sometimes, these subgroups have conflicting political priorities and goals.
As of 2013, Chinese Americans were the least likely Asian-American ethnicity to be affiliated with a political party.[63]
Chinese Americans tend to be clustered in majority-Democratic states and have increasingly voted Democratic in recent presidential elections, following the trend for Asian Americans in general, excluding the Vietnamese Americans.[64] Polling just before the 2004 U.S. Presidential Election found John Kerry was favored by 58% of Chinese Americans and George W. Bush by only 23%,[65] as compared with a 54/44 split in California, a 58/40 split in New York, and a 48/51 split in America as a whole on Election Day itself. In the 2012 presidential election, 81% of Chinese American voters selected Barack Obama over Mitt Romney.[66]
Cuisine
Chinese American cuisine originated with this ethnic group. Many immigrants in the mid-20th century used Chinese restaurants as a way of having employment. By 2019, many such establishments were closing because the price point commanded by the public was not sufficiently profitable, and younger generations gained more lucrative careers and were not interested in inheriting the restaurants.[67]
By 2016 there was a trend of Chinese immigrants, especially of Fujian ancestry, opening Japanese-style restaurants. This is due to overcompetition in the Chinese-style cuisine sector and because the American public generally pays more money for Japanese-style cuisine.[68] In 2016, Chinese Americans owned the majority of Japanese-style restaurants in Rochester, New York.[69]
Modern immigration
Economic growth in the People's Republic of China has given mainland Chinese more opportunities to emigrate. A 2011 survey showed that 60% of Chinese millionaires were planning to emigrate, with 40% of Chinese millionaires selecting the United States as the top destination for immigration.[70][71][72][73][74] The EB-5 Investment Visa allows many Chinese to seek U.S. citizenship. It has a yearly quota of around 10,000 applicants or families, and recent reports show that 75% of applicants for this visa in 2011 were Chinese.[75][76] Under this program, applicants, together with their spouses and unmarried children under 21 years old will be eligible to apply for U.S. permanent residency as a group. Because the EB-5 program allows applicants to apply as a family, it has been reported to be a significant method for Chinese students to obtain authorization to work in the United States. Chinese multimillionaires benefited most from the EB-5 Immigrant Investor Program in the U.S. now,[when?] as long as one has at least US$500,000 to invest in projects listed by United States Citizenship and Immigration Services (USCIS), where it is possible to get an EB-5 green card that comes with permanent U.S. residency rights, but only in states specified by the pilot project.[77][78] The H-1B visa is also becoming one of the main immigration pathways for the Chinese with 9% of the approved petitions in 2016.[79]
Illegal immigration
Before 1882, there were no limits on immigration to the United States, but with the Chinese Exclusion Act, for the first time in American history immigration was deemed illegal. This legislation was partially repealed in 1943 with the Magnuson Act, and only fully repealed in 1965. The history of illegal immigration of Chinese people to the United States go back to the 19th century.[80] Smuggling of immigrants without authorization increased during 1990s following policy changes by the American government, but by the 21st century some have returned to China due to its growing economy.[81] By 2017, it is estimated that more than a quarter million immigrants reside in the United States without authorization from China.[82] In 2015, there were about 39,000 Chinese nationals who were supposed to be deported; however, the People's Republic of China government had not provided paperwork to verify their citizenship.[83] In 2017, China was described as having become one of the leading sources of new immigrants without authorization.[84]
Socioeconomics
Educational attainment
Overall, as a demographic group, Chinese Americans have a higher educational attainment, have a higher percentage of people working in select white collar and professional occupations, and earn higher median household incomes compared to other demographic groups in the United States.[85] Chinese Americans, along with other East Asian Americans, typically exhibit above-average rates of academic achievement and higher educational attainment rates compared to other ethno-racial demographic cohorts within the United States.[86] Chinese Americans often have some[clarification needed] of the highest averages in tests such as SAT, ACT, GRE etc. in the United States. Although verbal scores lag somewhat due to the influx of new immigrants, combined SAT scores have also been higher than for most Americans.[87] With above average SAT and ACT scores as well as GPA's, Chinese Americans are more likely to apply to competitively elite, prestigious, and high-ranked higher education institutions than other ethno-racial groups in the United States.[88][89][90][91]
China sends the most international students to the U.S., with Chinese students accounting for 33.2% of the international student population. In the 2017–2018 school year, there were close to 363,000 enrolled students in higher education.[92] Chinese students also make up 32.2% of the undergraduate students and 48.8% of the graduate students.
International students
International students studying at various higher education institutions around the United States account for a significant percentage of the international student body. According to a Brookings Institution report analyzing foreign student visa approvals from 2008 to 2012, Michigan State University has the highest enrollment of Chinese international students in the United States, with roughly 4,700 Chinese citizens enrolled during the period of the study making up 62 percent of the 7,568 international students enrolled at MSU.[93] International undergraduates, who make up 38 percent of Purdue's undergraduate body, come from China more than any other country.[94] International Chinese students make up 49.8 percent of all international students at the University of Southern California.[95] International Chinese students are also 60 percent of the 6039 international students enrolled at Ohio State University.[96] Mainland China is the top sending country of international students to the United States.[97][note 1] After the 1970s, the globalization and Chinese Reform and Opening-Up Act resulted in a growing economy, more middle-class families from China are able to afford American college tuition, bringing an influx of Chinese students to study abroad in the United States. With a more diverse educational background and higher level of English proficiency, international Chinese students also value American degrees, as it gives them a notable advantage over their college-educated counterparts in China by the time they return to their native country to seek employment.[98]
Choice of institution
Due to cultural differences and socioeconomic factors, many Chinese international students are prestige-oriented and brand name conscious, choosing nationally ranked elite higher education institutes such as Harvard, Stanford, and MIT throughout the United States as their target schools.[99][100][101] International Chinese students are also widely found at many elite liberal arts colleges such as Barnard College and Mount Holyoke College.[102][103] Students from China gravitate towards Americans colleges and universities for their high quality and the style of education which stresses interdisciplinary approaches, argumentative analysis, creativity, student participation, and critical thinking.[101]
Area of study
As a result of differences in cultural factors in addition to extensive parental involvement and family preferences in the decision-making process with regards to what university majors to pursue that are optimally suited for one's future career path. In comparison to the social sciences and humanities, Chinese international students tend to gravitate towards technical and scientific majors that involve the heavy use of mathematics such as engineering; formal sciences such as computer science, statistics, and mathematics; and the natural sciences such as physics, chemistry, and biology. These factors, coupled with the growing economic affluence and wealth in East Asia, have led many modern Chinese parents hailing from upper and middle-class households to see and take advantage of the benefits of harnessing modern science and technology as a means of charting a pathway for accelerating China's and the rest of East Asia's inexorable economic advancement into the future. The value of pursuing a STEM-focused education has greatly increased in importance and is highly regarded for its perceived greater worth and long-term benefits in terms of the lifetime educational, career, and financial returns on investment associated with obtaining a degree. Chinese American families, in addition to other East Asian American parents, also attach a higher value to university degrees in STEM fields due to the belief that such degrees not only pave the way for practical career paths and prestigious job opportunities, but also offer the added benefit in which pursuit of such degrees would ensure their children a higher socioeconomic status and more financially rewarding outcomes compared to their liberal arts, social sciences, and humanities counterparts.[104]
While 27.5% of international Chinese students have chosen business administration, finance, or economics as their future area of study and academic focus, 19.2% of Chinese international students pursue engineering, 11.5% have chosen to take up the life sciences, and 10.6% study math and computer science.[105]
Largely driven by educational immigration, among American PhD recipients in fields related to science and engineering, 25% of the recipients are of Chinese descent.[106]
Level of education
According to the 2021 U.S. Census Bureau of Labor Statistics, 58.6% of all Chinese Americans have attained at least a bachelor's degree, compared with 35.0% nationally and 56.4% for all Asian-American groups. The 2021 U.S. Census also reports that 60.6% of Chinese American men attained a bachelor's degree and 56.9% of Chinese American women attained a bachelor's degree at a minimum. In addition, 31.0% of all Chinese Americans in the United States possess at least a master's, doctorate or other graduate and professional degree, compared to 25.8% for all Asian Americans, and is a little more than two times above the national average of 13.8%.[107]
| Ethnicity | Percent of Population |
|---|---|
| Chinese | 58.6% |
| Japanese | 54.6% |
| Korean | 60.7% |
| Asian | 56.4% |
| Taiwanese | 80.8% |
| Total U.S. Population | 35.0% |
Employment

Perceptions and change
There has been a significant change in the perceptions about Chinese Americans among the general American populace. In as little as a century of American history, stereotypes of Chinese and other East Asian Americans have changed from being perceived as indentured and uneducated coolie laborers who were perpetually entangled in an endlessly hopeless cycle of socioeconomic destitution towards a modern juxtaposed portrayal of them being an intelligent, conscientious, and a highly educated minority group. Most Chinese Americans work as white-collar professionals, many of whom are highly educated and salaried professionals whose work is largely self-directed in management, professional, and related occupations such as engineering, medicine, finance, law, and academia. 63.1% of Chinese Americans work in white-collar professions compared with 57.5% for all Asian Americans and a U.S. national average of 42.2%.[107] Chinese Americans also make up a third of the Asian-American high-tech professional workforce and one-tenth of the entire Silicon Valley workforce.[109] Chinese American unemployment rates are comparable with the general U.S. population average with a figure of 6.4% compared to a national rate of 6.3% in 2021.[107]
Medicine
Between 2008 and 2017, the number of Chinese-educated physicians practicing in the United States rose by 38.1%, and the total number of Chinese-educated physicians actively practicing in the United States was about 0.6% of the active physician workforce in 2017.[110]
Technology sector
A significant number of Chinese Americans, who possess the required specialized expertise and qualifications in engineering and highly-technical domains, have gravitated towards Silicon Valley, the prominent hub of high-technology in the United States in search of job prospects or to establish their own high-technology start-up business ventures. Many up-and-coming foreign-born Chinese and Chinese-American technology entrepreneurs endeavor to leverage their technical skillsets by initiating the new promising high-technology startups of tomorrow. Such ambitiously aspirant technology entrepreneurs benefit from the fulsome availability of venture capital, profound business acumen, and enticing financial incentives prevalent in the region, all strategically aimed and specifically tailored at fostering and nurturing technological innovation. Ethnic Chinese have been successful in starting new firms in technology centers across the United States. Chinese Americans have enjoyed a vast disproportion of entrepreneurial and investment success in various U.S.-based high-technology centers and sectors, as evidenced by the 2010 Goldsea 100 Compilation of America's Most Successful Asian Entrepreneurs.[111] Chinese Americans accounted for 4% of people listed in the 1998 Forbes Hi Tech 100 List.[112]
Annalee Saxenian, a UC Berkeley professor, whose scholarly research interests include the contribution of Chinese immigrants on America's high-technology realm carried out a study that showed that since 1998, one out of five high-tech start-ups in Silicon Valley were led by a Chinese American. During the same year, 5 of the 8 fastest growing high-technology companies in Silicon Valley had a leading upper-level management executive who was of Chinese ancestry, except for Yahoo, whose Jerry Yang was a founder and owner, but was not serving in an executive leadership position. In Silicon Valley, several Chinese American community organizations, numbering from two to three dozen, actively strive to look out for and are committed to safeguarding the professional interests and well-being of the Chinese American community. These organizations boast membership counts with at least 100 individual members, with one particularly influential group being the Committee of 100.[113] Immigrants from mainland China and Taiwan were key founders in 12.8% of all Silicon Valley start-ups between 1995 and 2005.[114] Almost 6% of the immigrants who founded companies in the innovation/manufacturing-related services field are from China.[115]
Research funded by the Public Policy Institute of California indicates that in 1996, 1,786 Silicon Valley technology companies with $12.5 billion in sales and 46,000 employees were run by executives of Indian or Chinese descent. Moreover, the pace of entrepreneurship among local immigrants has been increasing rapidly. While executives of Chinese or Indian origin were at the helm of 13% of the Silicon Valley technology businesses started between 1980 and 1985, they were also running 27% of the more than 4,000 businesses started between 1991 and 1996.[116] Start-up firms remain a primary source for new ideas and innovation for Chinese American internet entrepreneurs. Many of them are employed or directly engaged in new start-up activities. The proportional share of start-up firms by ethnic Chinese in Silicon Valley skyrocketed from 9% in 1980–1984 to about 20% between 1995 and 1998.[117] By 2006, Chinese American high-technology entrepreneurs were behind 20 percent of all Silicon Valley start-up firms, leading 2000 Silicon Valley companies, and employing 58,000 workers.[106] Today, Chinese Americans still continue to own about 20% of all U.S.-based information technology companies that were founded in Silicon Valley since 1980.
Numerous professional organizations in perspective in the 1990s as a support network for fellow Chinese American high tech start-ups in the valley.[118] Between 1980 and 1999, 17% of the 11,443 high-tech firms in Silicon Valley—including some 40 publicly traded firms were controlled by an owner of Chinese ancestry. In 1990, Chinese Americans made up a third of the Asian-American high-tech professional workforce in addition to 11% of the entire Silicon Valley professional workforce. In 1998, Chinese Americans managed 2001 firms, employing 41,684 workers, and ran up 13.2 billion in sales. They also accounted for 17% of all Silicon Valley high-technology business owners, 10% of the professional high-technology workforce in the Valley, and 13.5% of the total sales all while accounting for less than 1% of the U.S. population at the time.[119]
Self-employment and entrepreneurship
Chinese Americans are also noted for their high rates of self-employment, as they have an extensive history of starting and owning their own businesses through various means of self-employment dating back to the California Gold Rush in the 1880s.[120] However, as more recent generations of Chinese Americans who have chose to seek higher education as another gateway to elevate themselves socioeconomically, rates of self-employment have been generally lower than population average.[121] In 2007, there were over 109,614 Chinese-owned employer firms, employing more than 780,000 workers, and generating more than $128 billion in revenue.[122]
Among Chinese-owned American firms, 40% were in the professional, scientific, and technical services sector, the accommodation and food services sector, and the repair, maintenance, personal, and laundry services sector. Chinese-owned U.S. firms were 2% of all U.S. businesses in these sectors. Wholesale trade and accommodation and food services accounted for 50.4% of Chinese-owned business revenue. 66,505 or 15.7% of Chinese-owned firms had receipts of $250,000 or more compared with 2% for all U.S. businesses.[122][123][124][125][126][127]
Economics
With their above average educational attainment rates, Chinese Americans from all socioeconomic backgrounds have achieved significant advances in their educational levels, occupational prestige, personal and household income, life expectancy, and other socioeconomic indicators. As the fulsome financial and socioeconomic opportunities offered by the United States have lifted many Chinese Americans out of poverty, and has allowed much of the community to channel their social mobility by elevating them into the ranks of America's middle and upper middle class, as well as the enjoyment of substantially high wellbeing relative to other minority ethno-racial groups in the United States.[128] However, Chinese American wealth vary greatly by region: For instance, in New York City, 22% of Chinese Americans live in poverty.[129]
Chinese Americans are more likely to own homes than the general American population. According to the 2000 U.S. Census, 65% of Chinese Americans owned a home, higher than the total population's rate of 54%.[130][131] In 2003, real estate economist Gary Painter of the University of Southern California Lusk Center for Real Estate Research found out that when comparing homeowners with similar income levels Los Angeles, the Chinese American home-ownership rate is 20% higher than Whites; in San Francisco, 23% higher; and in the New York metropolitan area, 18% higher.[132] A 2008 Asian Real Estate Association of America report released on behalf of the American community survey, Chinese Americans living in the states of Texas, New York, and California all had high home ownership rates that were significantly near or above the general population average.[133]
According to the 2021 U.S. Census, Chinese American men had a full-time median income of $91,138 and Chinese American women had a median income of $75,148. Chinese Americans also have one of the highest median household incomes relatively in comparison to their fellow East Asian American community counterparts. And also one of the highest among most minority and non-white demographic ethno-racial groups in the United States, which is approximately one-third higher than the US national average, but is slightly lower compared with the general Asian-American population.[107]
| Ethnicity | Household income |
|---|---|
| Japanese | $87,789 |
| Taiwanese | $119,022 |
| Asian | $100,572 |
| Chinese | $93,007 |
| Korean | $82,946 |
| Total U.S. population | $69,717 |
Despite overwhelmingly positive economic indicators and socioeconomic patterns compared to other non-white ethno-racial groups in the United States, a number of economic deterrents have been noted to afflict the Chinese American community including institutionalized discrimination against STEM researchers, engineers, and scientists of Chinese descent. While the median income of Chinese American households remains above most non-white ethno-racial groups in the United States, studies in the wake of the 2008 financial crisis revealed that East Asian men have witnessed the highest rate of persistent long-term unemployment.[134] In addition, studies have shown that Asian Americans have been discriminated in companies with lower pay grades; even in larger high-tech corporate settings such as Google.[135]
Genetics
Studies on the genetics of Chinese Americans
A research on the whole genome patterns of common DNA variation in different human populations (African-American, Asian-American and European American) finds some common single-nucleotide polymorphisms (SNPs) in these three populations with diverse ancestry.[136] In the samples of Han Chinese in America, 74% of the total SNPs have two alleles, and majority of the segregating SNPs have a minor allele frequency (MAF) greater than 10%. Another noticeable point is that MAFs show similar distributions in European-American and Han Chinese populations. Besides, rarer haplotype is found to be absent in the samples of Han Chinese, and they also possess a high level of redundancy.[citation needed]
A study analyzing East Asian Genetic Substructure using genome-wide SNP arrays is carried out with greater than 200,000 genotypes from people of East Asian ancestry.[137] The continental populations are from the Human Genome Diversity Panel (Cambodian, Yi, Daur, Mongolian, Lahu, Dai, Hezhen, Miaozu, Naxi, Oroqen, She, Tu, Tujia, Naxi, Xibo, and Yakut), HapMap (Han Chinese and Japanese), as well as East Asian or East Asian-American subjects of Vietnamese, Korean, Filipino and Chinese ancestry. A clear understanding of the genetic substructure of any population helps in the studies of complex diseases, as well as the design and execution of association tests. Results of this study have identified markers that can not only reduce type 1 errors in future genetic disease studies, but also identify homogeneous groups and hence make this study more powerful.[citation needed]
The group of Chinese Americans in the same study consists of subjects with origins from North China, South China and Taiwan. This group is paired with Han Chinese from Beijing, and results indicate that the population differentiation values was small (<0.0025). There is substantially less genetic substructure between Han Chinese and Chinese American, compared with that between Han Chinese, Japanese and Korean groups, yet there is still a substructure in principal component, according to the split half reliability test.[citation needed]
Another study aiming to estimate cardiometabolic risk profile of Chinese adults with diabetes is also useful to reveal the personal genomics of Chinese Americans.[138] In this study, all subjects are over 18 years old and non-institutionalized. Results derived from a complex, multistage, probability sampling design show that 12,607 out of 98,658 Chinese adults are suffering from diabetes, based on the criteria of 2010 American Diabetes Association. In addition, the study reaches a conclusion that for those Chinese adults defined with diabetes, cardiometabolic risk factors are highly prevalent, including metabolic syndrome, systolic blood pressure that is higher than 140mmHg, low fruit and vegetable intake, low-density lipoprotein cholesterol that is higher than 110 mg/dL.[citation needed]
Diabetes
The circumstance of the Asian-American population is informative in a way that some knowledge about Chinese Americans can be inferred from it. The statistics of diabetes in Asian-American population reveals that approximately 10% of the entire population are diabetic, and in which 90–95% are type 2 diabetes.[139] The current situation is that there are some challenges in diagnosing diabetes in many Asian Americans. The main obstacle is that many clinical features along with risks factors associated with diabetes are obtained from studies that focus on Caucasian populations, which might result in misdiagnoses between type 1 and type 2 diabetes for Asian Americans. In fact, the reason why classic features of type 1 and type 2 diabetes in America might not apply to Asian-American population is about shared absence of common HLA DR-DQ genotype, low prevalence of positive anti-islet antibodies and low BMI in both types of diabetes.[140]
Some other studies have pointed out that for people of Asian descent and without diabetes, their insulin resistance levels are higher than non-diabetic people of Caucasian descent. Thus, Asian Americans are relatively more predisposed to develop type 2 diabetes. This suggests that insulin resistance, rather than body mass index (BMI) should be targeted while making diagnoses. A potential biomarker to identify diabetes in young Asian-American population is adipocyte fatty acid binding protein that has a strong association with insulin resistance but is independent of adiposity. Nevertheless, more research studies should be carried out in order to confirm such finding. With further applying the above outcome on the population of Chinese Americans, it is rational that there is a higher tendency for type 2 diabetes among this group of people, who also face the challenge of correct diagnosis in America.[citation needed]
Mental illness

Genetic mental illness is stigmatized in China. A study compares the attitude of Chinese Americans towards mental illness with genetic causes and that of European American. It finds out that there is a perception of eugenics existing among Chinese Americans.[141] Consequently, in order to reduce the stigma in the society, more efforts should be devoted to this population.[citation needed]
Stigma and eugenics
The journal launched by the above study highlights the idea of genetic essentialism, namely, genes are largely deterministic of individual characteristics and behavior. There is a separation between the normal and the deviant, which drives the process of stigma labeling. On the other hand, since genetic diseases can be passed on from one generation to another, some mental illnesses are shared in a family, stigmatizing all members involved. Another viewpoint relevant to genetic essentialism is that, since genes are perceived by the common people as difficult to modify, genetic mental illness is likely to persist, and so is the stigma. As a result, the mindset of many Chinese Americans is formulated as diseases with genetic causes being more serious than those without.[citation needed]
The same journal also delivers some hypotheses made on the basis of the long history of eugenics in China. First, Chinese Americans are more in favor of eugenic policies than European Americans. Secondly, more stigma would be generated towards genetic attributions of any diseases in Chinese American population. China used to implement restrictions on marriage licenses to people with genetic illnesses, which has made the attitude of Chinese Americans towards premarital genetic screening more supportive, especially when facing a chance of genetic defects. Moreover, from the perspective of this group of people, knowing whether a marriage partner has family history of mental illness with genetic basis is fairly important.[citation needed]
Notable Chinese Americans
- Iris Chang (28 March 1968 – 9 November 2004), historian, her publishings included: Thread of the Silkworm (1995), The Rape of Nanking: The Forgotten Holocaust of World War Two (1997)
- Mike Chen, popular food Youtuber (Strictly Dumpling).
- Charles Kuen Kao, physicist, winner of Nobel Prize in Physics in 2009 for the work on fiber optics, using laser to transmit digital data through glass fiber.
- Bruce Lee, martial artist and actor, founder of Jeet Kune Do.
- Tsung-Dao Lee, physicist, won the Nobel Prize in Physics (1957) with Yang Chen-Ning for their work on the violation of the parity law in weak interactions.
- Jeremy Shu-How Lin, professional basketball player, played in NBA for several years and a Harvard graduate.
- Gary Locke, politician and diplomat, the 10th United States ambassador to China (2011–2014), 21st Governor of Washington (1997–2005) and served in the Obama administration as United States Secretary of Commerce (2009–11).
- Ben Ming, New Hampshire State Representative and first Chinese-American elected to the New Hampshire General Court.[142]
- Amy Ruth Tan, writer, author of The Joy Luck Club.
- Samuel Chao Chung Ting, physicist, one of the two winners of Nobel Prize in Physics in 1976 for the work on the discovery of J/ψ meson.
- Daniel Chee Tsui, physicist, one of the winners of Nobel Prize in Physics in 1998 for the work on the discovery of a new form of quantum fluid with fractionally charged excitations.
- Charles B. Wang, businessman, a co-founder and CEO of Computer Associates International, Inc. (later renamed to CA Technologies).
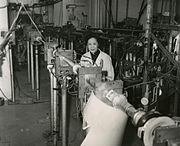
- Chien-Shiung Wu, physicist who was called by scientists, "The First Lady of Physics" for her experimental discovery of parity violation in weak interaction proposed by Chen-Ning Yang and Tsung-Dao Lee, both of whom won Nobel Prize. She also made the crucial study that showed the problem with Xenon in nuclear reactors for the Manhattan Project. Her work was not publicly recognized except by top scientists until 1978 when she was given the Wolf Prize.
- Michelle Wu, first Asian-American mayor of Boston, born in the U.S..
- Andrew Yang, entrepreneur, politician, lawyer, and 2020 Democratic presidential candidate.
- Shing-Tung Yau, mathematician, who won the Fields Medal in 1982 before becoming an American citizen in 1990.
- Eric Yuan, billionaire businessman and founder of Zoom Video Communications.
-
 Shiing-Shen Chern, Wolf Prize winner, considered one of the greatest mathematicians of the 20th century
 -
 Steven Chu, Nobel prize winner in physics, 1997 and former United States Secretary of Energy
 -
 Terence Tao, child prodigy, won Fields medal, 2006
 -
 Ching W. Tang, inventor of the organic light-emitting diode (OLED) and the hetero-junction organic photovoltaic cell (OPV); winner of the 2011 Wolf Prize in Chemistry
 -
 Roger Y. Tsien, Nobel prize winner in chemistry, 2009
 -
-
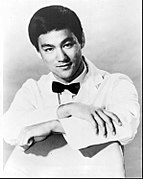 Bruce Lee, famed actor, director and martial artist
 -
 I. M. Pei, architect behind the pyramid of the Louvre, which is its main attraction; also designed the Rock and Roll Hall of Fame museum


Media
The World Journal is the most famous Chinese newspapers in the North America.
Newspapers
- World Journal
- Sing Tao Daily
- Ming Pao
- Chinese-American Times (1955–1972)
Television
- SinoVision
- ETTV America
- Voice of America (Chinese)
- Epoch Times
- New Tang Dynasty Television
- Phoenix Television
- Television Broadcasts Limited (TVB USA)
- Asia Television
Radio
- Chinese Radio Seattle. (M-T 9:00pm–12:00am Fri-Sun 7:00pm-12:1 m AM1150 KKNW/HD-3 FM 98.9/Mobile App: Chinese Radio Seattle) Studio in Bellevue, Washington.
- China Radio International can be heard in the following cities:
- Washington, D.C., on WUST (AM 1120 kHz between 9 a.m.–11 a.m.)
- Chinese American Voice,[143] heard over a SCA subcarrier of WACD-FM in the New York/New Jersey/Connecticut tri-state area
- Chinese American Voice, heard in New York City 24 hours on the 92 kHz subcarrier of WQCD-FM 101.9 MHz.
- Chinese Radio Network [7] on WGBB (AM 1240 kHz and the 67 kHz subcarrier of WCBS-FM 101.1 MHz, Flushing, New York) broadcasts in Mandarin.
- Chung Wah Chinese Broadcasting Company [8] heard in New York City 24 hours on the 92 kHz subcarrier of WSKQ-FM 97.9 MHz.
- Multicultural Radio Broadcasting Inc.'s Chinese Media Group broadcasts Chinese programming in the following cities:
- KAHZ, Los Angeles is a Mandarin-dialect station.
- KAZN, Los Angeles is a Mandarin-dialect station.
- KTWR, Guam [9] is a shortwave radio station that broadcasts in Mandarin and other languages to the Asia-Pacific region.
- KMRB, Los Angeles is a Cantonese-dialect station.
- Sinocast Radio, national Chinese network, heard in New York City on the 67 kHz subcarrier of WXRK-FM 92.3 MHz.
- WKDM, New York/New Jersey/Connecticut tri-state area is a Mandarin-dialect station on AM 1380 kHz.
- WZRC, New York/New Jersey/Connecticut tri-state area is a Cantonese-dialect station on AM 1480 kHz.
- Radio Taiwan International is broadcast on WYFR from Okeechobee, Florida on shortwave 5950 kHz in the United States sometime after 5 p.m./6 p.m. until early morning. This broadcast can be received virtually through the entire United States using a shortwave radio.
- KVTO (Sing Tao) on 1400AM in San Francisco.
- KEST, San Francisco is a Cantonese-dialect station.
- KSQQ, San Francisco is a Mandarin-dialect station.
See also
- Taiwanese Americans
- Chinese Consolidated Benevolent Association (CCBA)
- Lin Sing Association
- Chinese Progressive Association
- Chinese Hand Laundry Alliance
- Chinatowns in the United States
- Chinese Americans in Boston
- Chinese people in New York City
- China–United States relations
- Taiwan-United States relations
- TAIPEI Act
- Taiwan Relations Act
- Taiwan Relations Act Affirmation and Naval Vessel Transfer Act of 2014
- Committee of 100 (United States)
- History of Chinese Americans in Los Angeles
- History of Chinese Americans in San Francisco
- American Chinese cuisine
Notes
- ^ The number of students studying in the US is rising even faster than China's GDP. During the 2010–11 academic year, 157,588 Chinese students were studying in the US – an increase of 23% from the previous year, according to the Institute of International Education.
References
- ^ "B02018 ASIAN ALONE OR IN ANY COMBINATION BY SELECTED GROUPS – 2021: 1-year estimates Detailed Tables – United States". United States Census Bureau.
- ^ "ACS DEMOGRAPHIC AND HOUSING ESTIMATES 2012 American Community Survey 1-Year Estimates New York-Newark-Bridgeport, NY-NJ-CT-PA CSA". U.S. Census Bureau. Archived from the original on 12 February 2020. Retrieved 27 October 2013.
- ^ a b c "Asian Americans: A Mosaic of Faiths". The Pew Forum on Religion & Public Life. Pew Research Center. 19 July 2012. Archived from the original on 16 July 2013. Retrieved 15 February 2013.
Unaffiliated 52%, Protestant 22%, Buddhist 15%, Catholic 8%
- ^ Ng, Franklin (1998). The Taiwanese Americans. Greenwood Publishing Group. pp. 2, 118, 126. ISBN 978-0-313-29762-5.
- ^ U.S. Census Bureau. "American FactFinder – Results". factfinder.census.gov. Archived from the original on 14 February 2020. Retrieved 1 October 2017.
- ^ "Race Reporting for the Asian Population by Selected Categories: 2010". U.S. Census Bureau. Archived from the original on 12 October 2016. Retrieved 17 January 2012.
- ^ "Chinese Immigrants in the United States". Migration Policy Institute. January 2012. Archived from the original on 12 May 2012. Retrieved 30 June 2012.
- ^ Wu, Olivia (18 February 2007). "Young Americans find roots in China / S.F. program offers history and genealogy, helps locate relatives". SFGATE. Retrieved 22 May 2023.
- ^ "A New Community | Chinese | Immigration and Relocation in U.S. History | Classroom Materials at the Library of Congress | Library of Congress". Library of Congress, Washington, D.C. 20540 USA. Retrieved 22 May 2023.
- ^ International World History Project. Asian Americans[usurped]. Retrieved 14 March 2014.
- ^ a b c d e "Milestones: 1866–1898 – Office of the Historian". History.state.gov. Archived from the original on 5 April 2019. Retrieved 15 December 2017.
- ^ Hsia, Lisa (2007). "Asians and Asian Americans in the West". In Mancall, Peter; Johnson, Benjamin Heber (eds.). Making of the American West: People and Perspectives. ABC-CLIO. pp. 161–187.
- ^ Bill Bryson, Made In America, page 154
- ^ Takaki, Ronald (1998). Strangers From a Different Shore. Little, Brown and Company. p. 28. ISBN 978-0-316-83109-3.
- ^ Chang, Iris (2003). The Chinese in America. Penguin Books. pp. 34–35. ISBN 978-0-670-03123-8.
- ^ Kwong, Peter; Miscevic, Dusanka (2005). Chinese America: The untold story of America's oldest new community. The New Press. p. 44. ISBN 978-1-56584-962-4.
- ^ "Our Composite Nationality". Teaching American History. Archived from the original on 17 April 2019. Retrieved 17 April 2019.
- ^ Evangelista, Susan (1983). "California's Third Oriental Wave: A Sociohistorical Analysis". Philippine Studies. 31 (1): 37–57. JSTOR 42632649. Retrieved 29 September 2023.
- ^ a b c Eileen Sullivan (24 November 2023). "Growing Numbers of Chinese Migrants Are Crossing the Southern Border". The New York Times. Retrieved 24 November 2023.
Most who have come to the United States in the past year were middle-class adults who have headed to New York after being released from custody. New York has been a prime destination for migrants from other nations as well, particularly Venezuelans, who rely on the city's resources, including its shelters. But few of the Chinese migrants are staying in the shelters. Instead, they are going where Chinese citizens have gone for generations: Flushing, Queens. Or to some, the Chinese Manhattan..."New York is a self-sufficient Chinese immigrants community," said the Rev. Mike Chan, the executive director of the Chinese Christian Herald Crusade, a faith-based group in the neighborhood.
- ^ US Census: Race and Hispanic or Latino: 2000 [1] Archived 12 February 2020 at archive.today; US Census: 1990 [2] Archived 11 August 2010 at the Wayback Machine; US Census: Population 1790–1990 [3] Archived 2 October 2018 at the Wayback Machine; Comparison of Asian Populations during the Exclusion Years [4] Archived 10 March 2007 at the Wayback Machine; Estimation of the US-Census for the year 2004 [5] Archived 12 February 2020 at archive.today
- ^ "Historical Census Statistics on Population Totals By Race, 1790 to 1990, and By Hispanic Origin, 1970 to 1990, For The United States, Regions, Divisions, and States". Archived from the original on 24 December 2014.
- ^ "U.S. Census Bureau Delivers Illinois' 2010 Census Population Totals, Including First Look at Race and Hispanic Origin Data for Legislative Redistricting". U.S. Census Bureau. Archived from the original on 19 February 2011. Retrieved 20 February 2011.
- ^ "ACS DEMOGRAPHIC AND HOUSING ESTIMATES 2012 American Community Survey 1-Year Estimates New York-Newark-Bridgeport, NY-NJ-CT-PA CSA". U.S. Census Bureau. Archived from the original on 12 February 2020. Retrieved 27 October 2013.
- ^ a b "ACS DEMOGRAPHIC AND HOUSING ESTIMATES 2017 American Community Survey 1-Year Estimates Chinese alone – New York City, New York". U.S. Census Bureau. Archived from the original on 14 February 2020. Retrieved 12 February 2019.
- ^ "SELECTED POPULATION PROFILE IN THE UNITED STATES 2017 American Community Survey 1-Year Estimates New York-Newark, NY-NJ-CT-PA CSA Chinese alone". United States Census Bureau. Archived from the original on 14 February 2020. Retrieved 12 February 2019.
- ^ * "Chinatown New York City Fact Sheet" (PDF). explorechinatown.com. Archived (PDF) from the original on 25 May 2017. Retrieved 2 March 2019.
- Waxman, Sarah. "The History of New York's Chinatown". Mediabridge Infosystems, Inc. Archived from the original on 25 May 2017. Retrieved 2 March 2019.
- Reimers, David M. (1992). Still the Golden Door: The Third World Comes to America. Columbia University Press. p. 104. ISBN 978-0-231-07681-4. Archived from the original on 28 March 2017. Retrieved 2 March 2019.
- McGlinn, Department of Geography SUNY-New Paltz, Lawrence A. "Beyond Chinatown: Dual immigration and the Chinese population of metropolitan New York City, 2000, Page 4" (PDF). Middle States Geographer, 2002, 35: 110–119, Journal of the Middle States Division of the Association of American Geographers. Archived from the original (PDF) on 29 October 2012. Retrieved 2 March 2019.
- Reimers, David M. (1992). Still the Golden Door: The Third World Comes to America. Columbia University Press. p. 104. ISBN 978-0-231-07681-4. Archived from the original on 28 March 2017. Retrieved 2 March 2019.
- ^ "American FactFinder". United States Census Bureau. 2010. Archived from the original on 12 February 2020. Retrieved 11 March 2012.
- ^ "USA". Chinatownology.com. Archived from the original on 21 December 2017. Retrieved 15 December 2017.
- ^ "Intern program". community.ups.com. Archived from the original on 23 August 2010.
- ^ Hayoun, Massoud (7 March 2012). "What China's Talking About Today: Is American Citizenship Still Desirable?". The Atlantic. Atlantic Media Company. Archived from the original on 25 May 2013. Retrieved 1 February 2013.
- ^ Robinson, Melia (27 May 2015). "This is what it's like in one of the biggest and fastest growing Chinatowns in the world". Business Insider. Archived from the original on 30 July 2017. Retrieved 3 March 2019.
- ^ Ngu, Sarah (29 January 2021). "'Not what it used to be': in New York, Flushing's Asian residents brace against gentrification". The Guardian US. Retrieved 13 August 2020.
The three developers have stressed in public hearings that they are not outsiders to Flushing, which is 69% Asian. 'They've been here, they live here, they work here, they've invested here,' said Ross Moskowitz, an attorney for the developers at a different public hearing in February...Tangram Tower, a luxury mixed-use development built by F&T. Last year, prices for two-bedroom apartments started at $1.15m...The influx of transnational capital and rise of luxury developments in Flushing has displaced longtime immigrant residents and small business owners, as well as disrupted its cultural and culinary landscape. These changes follow the familiar script of gentrification, but with a change of actors: it is Chinese-American developers and wealthy Chinese immigrants who are gentrifying this working-class neighborhood, which is majority Chinese.
- ^ Davidson, Justin (15 December 2022). "Can the Hochul-Adams New New York Actually Happen?". Curbed - New York magazine. Retrieved 18 December 2022.
- ^ "Yearbook of Immigration Statistics: 2013 Supplemental Table 2". U.S. Department of Homeland Security. Archived from the original on 13 October 2016. Retrieved 19 June 2014.
- ^ "Yearbook of Immigration Statistics: 2012 Supplemental Table 2". U.S. Department of Homeland Security. Archived from the original on 3 April 2013. Retrieved 5 May 2013.
- ^ "Yearbook of Immigration Statistics: 2011 Supplemental Table 2". U.S. Department of Homeland Security. Archived from the original on 8 August 2012. Retrieved 5 May 2013.
- ^ "Yearbook of Immigration Statistics: 2010 Supplemental Table 2". U.S. Department of Homeland Security. Archived from the original on 12 July 2012. Retrieved 5 May 2013.
- ^ Marzulli, John (9 May 2011). "Malaysian man smuggled illegal Chinese immigrants into Brooklyn using Queen Mary 2". New York Daily News. Archived from the original on 5 May 2015. Retrieved 6 April 2012.
- ^ Yee, Vivian (22 February 2015). "Indictment of New York Officer Divides Chinese-Americans". The New York Times. Archived from the original on 24 February 2015. Retrieved 23 February 2015.
- ^ "Chinese New Year 2012 in Flushing". QueensBuzz.com. 25 January 2012. Archived from the original on 26 May 2013. Retrieved 23 February 2015.
- ^ "SELECTED POPULATION PROFILE IN THE UNITED STATES 2017 American Community Survey 1-Year Estimates New York-Newark, NY-NJ-CT-PA CSA Chinese alone". United States Census Bureau. Archived from the original on 14 February 2020. Retrieved 27 January 2019.
- ^ a b Haiming Liu (2005) "Asian-American Ideas (Cultural Migration)" In Horowitz, Maryanne Cline (editor) (2005) New Dictionary of the History of Ideas Charles Scribner's Sons, Detroit, Michigan, volume 1, pp. 158–160, ISBN 0-684-31377-4
- ^ Semple, Kirk (21 August 2008) "Among Chinese-Americans, a Split on Sports" Archived 1 December 2016 at the Wayback Machine The New York Times page B-2
- ^ Berson, Misha. "A 'Drum' with a Difference" Archived 28 September 2007 at the Wayback Machine. American Theatre magazine, Theatre Communications Group, 2002. Retrieved 9 November 2010.
- ^ Hwang, directed by Leigh Silverman, David Henry. "Chinglish". Broadway's Best Shows, Longacre Theatre. Archived from the original on 8 October 2011. Retrieved 5 May 2013.
{{cite web}}: CS1 maint: unfit URL (link) - ^ a b "Committee of 100 Announces Results of Landmark National Survey on American Attitudes towards Chinese Americans and Asian Americans". 25 April 2001. Archived from the original on 29 September 2007. Retrieved 14 June 2007.
- ^ Yi, Matthew; et al. (27 April 2001). "Asian Americans seen negatively". The San Francisco Chronicle. Archived from the original on 14 September 2011. Retrieved 14 June 2007.
- ^ Wortman, Roy T. "Denver's Anti-Chinese Riot, 1880" (PDF). Colorado Magazine. 43 (4): 265–291.
- ^ The Associated Press (30 October 1996). "Race riot tore apart Denver's Chinatown". Eugene Register-Guard. Retrieved 26 October 2023.
- ^ Georg Hsu, L.K.; Wan, Yu Mui; Chang, Hong; Summergrad, Paul; Tsang, Bill Y.P.; Chen, Hongtu (September 2008). "Stigma of Depression Is More Severe in Chinese Americans than Caucasian Americans". Psychiatry: Interpersonal and Biological Processes. 71 (3): 210–218. doi:10.1521/psyc.2008.71.3.210. PMID 18834272. S2CID 23003033.
- ^ a b Yeung, Albert (1 December 2006). "Recognizing and Treating Depression in Asian Americans". Psychiatric Times. 23 (14): 50. Gale A156586134.
- ^ a b Blinn, Robert Eugene (1996). Asian-American and Chinese-American suicide in San Francisco (Thesis). ProQuest 304289210.
- ^ a b Dong, XinQi; Chen, Ruijia; Li, Chengyue; Simon, Melissa A. (October 2014). "Understanding Depressive Symptoms Among Community-Dwelling Chinese Older Adults in the Greater Chicago Area". Journal of Aging and Health. 26 (7): 1155–1171. doi:10.1177/0898264314527611. PMC 9944289. PMID 25239971. S2CID 33772989.
- ^ a b Lai, H. Mark (2004). Becoming Chinese American: A History of Communities and Institutions. AltaMira Press. ISBN 978-0-7591-0458-7.
- ^ García, Ofelia; Fishman, Joshua A. (2002). The Multilingual Apple: Languages in New York City. Walter de Gruyter. ISBN 978-3-11-017281-2.
- ^ See, for instance, https://www.irs.gov/irm/part22/irm_22-031-001.html Archived 3 March 2016 at the Wayback Machine (Internal Revenue Manual 22.31.1.6.3 – "The standard language for translation is Traditional Chinese."
- ^ a b "Chinese Americans". Projects.pewforum.org. 18 July 2012. Archived from the original on 3 August 2017. Retrieved 15 December 2017.
- ^ Pine, Dan (6 March 2015). "When you're Asian and Jewish, you get questions". J. The Jewish News of Northern California. Archived from the original on 15 March 2017. Retrieved 8 May 2020.
- ^ Ghert-Zand, Renee (13 October 2016). "With Jewish-Asian marriages on the rise, academic couple takes on subject close to home". The Times of Israel. Archived from the original on 24 June 2019. Retrieved 8 May 2020.
- ^ Buckley, Chris (25 September 2016). "Jewish and Chinese: Explaining a Shared Identity". The New York Times. Archived from the original on 29 March 2020. Retrieved 8 May 2020.
{{cite news}}: CS1 maint: unfit URL (link) - ^ "Group: Officials destroying crosses, burning bibles in China". AP NEWS. 10 September 2018. Archived from the original on 11 January 2020. Retrieved 9 December 2019.
- ^ University, Berkley Center for Religion, Peace and World Affairs at Georgetown. "Freedom of Religion in China: A Historical Perspective". berkleycenter.georgetown.edu. Archived from the original on 3 September 2019. Retrieved 9 December 2019.
{{cite web}}: CS1 maint: multiple names: authors list (link) - ^ Hilburn, Matthew (17 January 2013). "Asian-American Vote Reveals Nuances". Voice of America. Archived from the original on 21 January 2013. Retrieved 24 January 2013.
Chinese-Americans were the least likely to affiliate with a party. Magpantay suggested that only one third of Chinese-Americans belong to a party, compared with 71% among all Asian-Americans, because of the negative association of the word party with the Communist Party in China.
- ^ [6] Archived 10 May 2013 at the Wayback Machine
- ^ "Asian-Americans lean toward Kerry". Asia Times. 16 September 2004. Archived from the original on 16 September 2004. Retrieved 22 September 2007.
{{cite web}}: CS1 maint: unfit URL (link) - ^ Hing, Julianne (18 January 2013). "Asian-American Voters Really, Really Loved Barack Obama in Election 2012". ColorLines. Archived from the original on 21 January 2013. Retrieved 11 November 2015.
- ^ Nierenberg, Amelia; Bui, Quoctrung (24 December 2019). "Chinese Restaurants Are Closing. That's a Good Thing, the Owners Say". The New York times. Retrieved 5 March 2024.
- ^ Swanson, Ana (29 September 2016). "Why so many of America's sushi restaurants are owned by Chinese immigrants". Washington Post. Retrieved 14 February 2024.
- ^ Chao, Mary (25 November 2016). "Chinese thriving in Japanese restaurant business". Democrat & Chronicle. Retrieved 14 February 2024.
- ^ "As China's rich grow in numbers, so do their mobile aspirations – CNN". CNN. 21 November 2011. Archived from the original on 19 September 2012. Retrieved 26 September 2012.
- ^ "Chinese millionaires seek for overseas activities- China Business Network". China-invests.net. Archived from the original on 21 July 2012. Retrieved 15 December 2017.
- ^ "Plan B for China's Wealthy: Moving to the U.S., Europe – WSJ.com". The Wall Street Journal. Archived from the original on 16 December 2017. Retrieved 3 August 2017.
- ^ "Report: Half of China's millionaires want to leave". CNN. 1 November 2011. Archived from the original on 11 July 2012.
- ^ "The Mass Migration of the Super-Rich – U.S. Business News". CNBC. Archived from the original on 3 April 2015. Retrieved 15 December 2017.
- ^ "Rich Chinese seeking overseas residency". BBC News. 22 August 2012. Archived from the original on 31 January 2019. Retrieved 21 July 2018.
- ^ 美国投资移民中国人占四分三 [3/4 of Investment Immigrants to the USA are Chinese] (in Simplified Chinese and English). Thinking Chinese. November 2011. Archived from the original on 25 May 2017. Retrieved 2 December 2019.
- ^ "U.S., Canada favored by China's third wave of emigrants – Headlines, features, photo and videos from". ecns.cn. Archived from the original on 4 February 2012. Retrieved 7 May 2012.
- ^ Yuk, Pan Kwan (12 June 2012). "China's capital flight: to US real estate". Financial Times. Archived from the original on 6 February 2022. Retrieved 15 December 2017.
- ^ "Characteristics of Specialty Occupation Workers H-1B" (PDF). USCIS. Archived from the original on 15 October 2020. Retrieved 10 July 2022.
- ^ Lipin, Michael (28 June 2016). "US Media Scrutinize Wave of Chinese Migrants Illegally Crossing From Mexico". Voice of America News. Archived from the original on 2 March 2018. Retrieved 1 March 2018.
- ^ Xiaoqing, Rong (4 January 2017). "The Fading American Dreams of China's Most Notorious 'Snakehead'". Foreign Policy. Washington, DC. Archived from the original on 2 March 2018. Retrieved 1 March 2018.
- ^ Yee, Vivian; Davis, Kenan; Patel, Jugal K. (6 March 2017). "Here's the Reality About Illegal Immigrants in the United States". The New York Times. Archived from the original on 29 June 2018. Retrieved 1 March 2018.
- ^ Hasenball, Mark; Reid, Tim (10 September 2015). "Exclusive – U.S. to China: Take back your undocumented immigrants". Reuters. Archived from the original on 26 March 2021. Retrieved 1 March 2018.
- ^ Wang, Hansi Lo (25 April 2017). "Mexicans No Longer Make Up Majority of Immigrants in U.S. Illegally". The Two-Way. NPR. Archived from the original on 2 March 2018. Retrieved 1 March 2018.
"Mexicans, Chinese among 30 illegal immigrants arrested by Border Patrol outside new San Diego smuggling tunnel". Fox News Channel. 27 August 2017. Archived from the original on 2 March 2018. Retrieved 1 March 2018.
Davis, Kristina (25 September 2017). "Growing number of Chinese immigrants smuggled through San Diego border". The San Diego Union-Tribune. Archived from the original on 2 March 2018. Retrieved 1 March 2018. - ^ Ticker, Neil (12 November 2008). "Major Study of Chinese Americans Debunks 'Model Minority' Myth". University of Maryland. Archived from the original on 18 May 2012. Retrieved 10 May 2012.
- ^ Choi, Daniel. "The Other Side of the Model Minority Myth". Yisei Magazine. Archived from the original on 27 October 2014. Retrieved 2 December 2013.
- ^ "Why Asian-Americans score so highly in the SAT & ACT". Study International. 30 November 2018. Archived from the original on 26 March 2021. Retrieved 3 September 2019.
- ^ Dharma, Tiffany (2011). "The Model Minority: Asian-American Youth and the Harmful Perpetuation of a Cultural Myth". Inquiries Journal. 3 (9): 2. Archived from the original on 11 October 2011. Retrieved 10 May 2012.
- ^ "Traditional Chinese parenting". Parenting Science. Archived from the original on 16 December 2011. Retrieved 31 December 2011.
- ^ "Awards". Arthurhu.com. Archived from the original on 25 December 2011. Retrieved 31 December 2011.
- ^ Scott Jaschik (22 August 2011). "Who Applies (and Gets in)". Inside Higher Ed. Archived from the original on 25 April 2012. Retrieved 26 February 2012.
Then there is the question of who applies to competitive colleges: the NELS data show that 30 percent of Asian American applicants do, compared to 18 percent of white students and 10 percent of black and Latino students.
- ^ "Europe opens its arms to Chinese students". China Daily. 9 June 2019. Archived from the original on 3 September 2019. Retrieved 3 September 2019.
- ^ Ruiz, Neil (30 November 2001). "The Geography of Foreign Students in U.S. Higher Education: Origins and Destinations". Brookings Institution. Archived from the original on 23 November 2014. Retrieved 24 November 2014.
- ^ Segalini, Antonio (10 September 2018). "Purdue celebrates more students than ever seeking high-quality, affordable education". Purdue University. Archived from the original on 3 September 2019. Retrieved 3 September 2019.
- ^ "All International Students by Country of Citizenship". University of Southern California. Archived from the original on 3 September 2019. Retrieved 3 September 2019.
- ^ Chenetski, Hannah (22 January 2014). "Majority of Ohio State Students Come from China". The Lantern. Archived from the original on 3 September 2019. Retrieved 3 September 2019.
- ^ Murray, Peter (16 November 2010). "China becomes No. 1 source for international students in U.S." Xinhua News Agency. Archived from the original on 25 May 2013. Retrieved 29 May 2012.
- ^ "Chinese students enrolling in U.S. colleges in record numbers". Chicago Sun-Times. 4 August 2011. Archived from the original on 29 January 2012. Retrieved 29 May 2012.
- ^ Johnson, Jenna (14 November 2011). "Chinese students enroll in record numbers at U.S. colleges". Post Local. Archived from the original on 25 October 2013. Retrieved 2 December 2013.
- ^ Mong, Adrienne (17 February 2013). "Chinese applications to U.S. schools skyrocket". Archived from the original on 7 May 2012. Retrieved 30 May 2012.
- ^ a b Gates, Megan (11 January 2012). "China's growing middle class means influx of students for U.S. colleges". USA Today College. Archived from the original on 6 September 2013. Retrieved 17 February 2013.
- ^ Daniel de Vise (4 January 2012). "Pitching U.S. liberal arts in China". The Washington Post. Archived from the original on 25 October 2013. Retrieved 2 December 2013.
{{cite news}}: CS1 maint: unfit URL (link) - ^ Vaccarello, Joe (19 January 2011). "Chinese student loving life in U.S. college". CNN. Archived from the original on 7 April 2012. Retrieved 30 May 2012.
- ^ Adams, Richard (3 December 2013). "East Asian countries top global league tables for educational performance". The Guardian. Archived from the original on 24 September 2020. Retrieved 29 August 2018.
- ^ Seaton, Debanina (4 March 2012). "American universities see an influx of students from China". The South End. Archived from the original on 9 March 2012. Retrieved 14 November 2018.
- ^ a b Yung, Judy; Chang, Gordon H.; Mark Lai, H. (20 March 2006). Chinese American Voices: From the Gold Rush to the Present – Judy Yung, Gordon H. Chang, H. Mark Lai. University of California Press. ISBN 978-0-520-24309-5. Archived from the original on 26 March 2021. Retrieved 21 April 2012.
- ^ a b c d e f "Selected Population Profile in the United States". United States Census Bureau. 2021. Retrieved 2 September 2023.
- ^ "Foreign-Born Entrepreneurs: An Underestimated American Resource". Kauffman.org. 30 September 2006. Archived from the original on 28 May 2012. Retrieved 21 April 2012.
- ^ "Chinese American Contributions to Silicon Valley". Modelminority.com. 31 March 2003. Archived from the original on 16 September 2013. Retrieved 21 April 2012.
- ^ Robbert J. Duvivier, John Boulet & Jason Z. Qu, The contribution of Chinese-educated physicians to health care in the United States Archived 21 July 2020 at the Wayback Machine, PLoS ONE 14(4): 2019, doi:10.1371/journal.pone.0214378.
- ^ "100 Most Successful Asian American Entrepreneurs". Archived from the original on 24 November 2010. Retrieved 28 December 2011.
- ^ "Awards". Arthurhu.com. Archived from the original on 25 December 2011. Retrieved 31 December 2011.
- ^ "Chinese American Contributions to Silicon Valley". Archived from the original on 16 September 2013. Retrieved 10 March 2012.
- ^ "Immigrant Entrepreneurs". Careerbright. Archived from the original on 23 June 2012. Retrieved 21 April 2012.
- ^ "South Asia news – More foreign cogs in the US engine". Asia Times. 12 January 2007. Archived from the original on 15 January 2007. Retrieved 21 April 2012.
{{cite web}}: CS1 maint: unfit URL (link) - ^ "A Valley Asset: Chinese, Indians Creating Businesses, Jobs, Wealth As Successful Entrepreneurs (PPIC Commentary)". Ppic.org. 21 June 1998. Archived from the original on 27 May 2013. Retrieved 21 April 2012.
- ^ Wong, Raymond Sin-Kwok (14 August 2008). Chinese Entrepreneurship in a Global Era – Raymond Sin-Kwok Wong. Routledge. ISBN 978-0-203-89488-0. Archived from the original on 26 March 2021. Retrieved 21 April 2012.
- ^ Zinzius, Birgit (2004). Doing Business in the New China: A Handbook and Guide – Birgit Zinzius. Greenwood Publishing. ISBN 978-0-275-98031-3. Archived from the original on 26 March 2021. Retrieved 21 April 2012.
- ^ Koehn, Peter H.; Yin, Xiao-Huang (31 May 2002). The Expanding Roles of Chinese Americans in U.S.-China Relations ... – Peter H. Koehn, Xiao-Huang Yin. M.E. Sharpe. ISBN 978-0-7656-0950-2. Archived from the original on 26 March 2021. Retrieved 21 April 2012.
- ^ Võ, Linda Trinh; Bonus, Rick (2009). Contemporary Asian American Communities: Intersections And Divergences – Linda Trinh Vő, Rick Bonus. Temple University Press. ISBN 978-1-4399-0124-3. Archived from the original on 26 March 2021. Retrieved 28 May 2012.
- ^ Gold, Steven J. (October 2006). "The Second Generation and Self-Employment". Migration Policy Institute. Archived from the original on 21 June 2012. Retrieved 28 May 2012.
- ^ a b "Survey of Business Owners". U.S. Census Bureau. Archived from the original on 7 January 2012. Retrieved 31 December 2011.
- ^ "Chinese-Owned Firms" (PDF). U.S. Census Bureau. Archived (PDF) from the original on 26 October 2011. Retrieved 31 December 2011.
- ^ "Number of Firms by Receipts Size of Firm: 2007" (PDF). U.S. Census Bureau. Archived (PDF) from the original on 26 October 2011. Retrieved 31 December 2011.
- ^ "Obama's Tax Plan and Small Businesses". Fox News Channel. 21 April 2011. Archived from the original on 10 May 2011. Retrieved 31 December 2011.
- ^ "Facts About Small Business Taxpayers". Small Business Trends. 20 December 2010. Archived from the original on 3 December 2013. Retrieved 2 December 2013.
- ^ "Romney Rejects Buffett's Call To Tax The Rich, Falsely Claims It Would Hurt Small Businesses". Think Progress. 15 August 2011. Archived from the original on 1 August 2012. Retrieved 31 December 2011.
- ^ U.S. Government. "U.S. economics" (PDF). Archived from the original (PDF) on 26 March 2010. Retrieved 25 March 2012.
- ^ "Working but Poor: Asian American Poverty in New York City" (PDF). Asian American Federation. October 2008.
- ^ "ASIAN AMERICAN CHARACTERISTICS.doc". ASIAN AMERICAN CHARACTERISTICS.doc. Archived from the original on 27 September 2013. Retrieved 10 May 2012.
- ^ Bureau, U.S. Census (2000). Chinese American Demographics. Améredia Incorporated. Archived from the original on 15 April 2012. Retrieved 10 May 2012.
- ^ Dooley, Tom (January 2003). "| -A A +A Industry Watch: Chinese Lead Immigrant Groups in Homeownership". National Association of Realtors. Archived from the original on 20 April 2013. Retrieved 10 May 2012.
- ^ Bryan, Chiu; Cruz-Viesca, Melany Dela (2008). "Following the Path to Asian American Home-ownership" (PDF). Asian Real Estate Association of America (AREAA) Via American Community Survey: 9–11. Archived from the original (PDF) on 17 October 2012. Retrieved 10 May 2012.
- ^ Hilburn, Matthew (25 May 2012). "Long-term Unemployment Hits Asian-Americans Hardest". VOA.
- ^ Wakabayashi, Daisuke (4 March 2019). "Google Finds It's Underpaying Many Men as It Addresses Wage Equity". The New York Times.
- ^ Hinds, David A.; Stuve, Laura L.; Nilsen, Geoffrey B.; Halperin, Eran; Eskin, Eleazar; Ballinger, Dennis G.; Frazer, Kelly A.; Cox, David R. (18 February 2005). "Whole-Genome Patterns of Common DNA Variation in Three Human Populations". Science. 307 (5712): 1072–1079. Bibcode:2005Sci...307.1072H. CiteSeerX 10.1.1.115.3580. doi:10.1126/science.1105436. PMID 15718463. S2CID 27107073.
- ^ Tian, Chao; Kosoy, Roman; Lee, Annette; Ransom, Michael; Belmont, John W.; Gregersen, Peter K.; Seldin, Michael F. (5 December 2008). "Analysis of East Asia Genetic Substructure Using Genome-Wide SNP Arrays". PLOS ONE. 3 (12): e3862. Bibcode:2008PLoSO...3.3862T. doi:10.1371/journal.pone.0003862. PMC 2587696. PMID 19057645.
- ^ Ding, Lin; Xu, Yu; Wang, Limin; Xu, Min; Jiang, Yong; Zhang, Mei; Li, Yichong; Lu, Jieli; Wang, Tiange; Dai, Meng; Zhang, Di; Wang, Weiqing; Zhao, Wenhua; Wang, Linhong; Bi, Yufang; Ning, Guang; 2010 China Non-communicable Disease Surveillance Group (January 2017). "The cardiometabolic risk profile of Chinese adults with diabetes: A nationwide cross-sectional survey". Journal of Diabetes and Its Complications. 31 (1): 43–52. doi:10.1016/j.jdiacomp.2016.10.023. PMID 27838099.
{{cite journal}}: CS1 maint: numeric names: authors list (link) - ^ "Overcoming the obstacles of diagnosing diabetes in Asian Americans | Public Health". Public Health. 27 November 2012. Archived from the original on 20 December 2016. Retrieved 4 December 2016.
- ^ Hsu, William C.; Okeke, Eyiuche; Cheung, Sophia; Keenan, Hillary; Tsui, Tracy; Cheng, Kyle; King, George L. (2 December 2011). "A Cross-Sectional Characterization of Insulin Resistance by Phenotype and Insulin Clamp in East Asian Americans with Type 1 and Type 2 Diabetes". PLOS ONE. 6 (12): e28311. Bibcode:2011PLoSO...628311H. doi:10.1371/journal.pone.0028311. PMC 3229556. PMID 22164267.
- ^ WonPat-Borja, Ahtoy J.; Yang, Lawrence H.; Link, Bruce G.; Phelan, Jo C. (January 2012). "Eugenics, genetics, and mental illness stigma in Chinese Americans". Social Psychiatry and Psychiatric Epidemiology. 47 (1): 145–156. doi:10.1007/s00127-010-0319-7. PMC 3141094. PMID 21079911.
- ^ "Hollis state representative says he's first Chinese-American in New Hampshire State House". WMUR. 12 December 2022. Retrieved 15 December 2023.
- ^ "Archived copy". Archived from the original on 24 August 2012. Retrieved 29 October 2013.
{{cite web}}: CS1 maint: archived copy as title (link)
Bibliography
- Brooks, Charlotte. American Exodus: Second-Generation Chinese Americans in China, 1901–1949 (University of California Press, 2019) online review Archived 14 December 2020 at the Wayback Machine.
- Chang, Gordon H. Ghosts of Gold Mountain: The Epic Story of the Chinese Who Built the Transcontinental Railroad. Boston: Houghton Mifflin Harcourt, 2019.
- Chang, Iris. The Chinese in America: A Narrative History. New York: Viking, 2003. ISBN 0-670-03123-2
- Chen, Shehong. Being Chinese, Becoming Chinese American Urbana, IL: University of Illinois Press, 2002) ISBN 0-252-02736-1
- Cheng, Cindy I-Fen. Citizens of Asian America: Democracy and Race during the Cold War (New York U. Press, 2013). 285p.
- Gillenkirk, Jeff and Motlow, James, "Bitter Melon: Inside America's Last Rural Chinese Town" (San Francisco, Nine Mile Press, 2015). 140 pp.
- Hsu, Madeline Y. The Good Immigrants: How the Yellow Peril Became the Model Minority. Princeton, NJ: Princeton University Press, 2015.
- Isaacs, Harold R. Scratches on Our Minds: American Images of China And India (1958) online
- Kwong, Peter and Dusanka Miscevic. Chinese America: The Untold Story of America's Oldest New Community (2005)
- Lee, Jonathan H. X. ed. Chinese Americans: The History and Culture of a People. Santa Monica, CA: ABC-CLIO, 2016.
- Ling, Huping, and Allan W. Austin, eds. Asian American History and Culture: An Encyclopedia (Routledge, 2015)
- Louie, Vivian S. Compelled To Excel: Immigration, Education, And Opportunity Among Chinese Americans, (Stanford U. Press, 2004) 272 pages, ISBN 0-8047-4985-X
- McClain, Charles. In Search of Equality: The Chinese Struggle Against Discrimination in Nineteenth-Century America Berkeley: University of California Press, 1994.
- Meng, Chih. Chinese American Understanding: A Sixty-Year Search, (China Institute in America, 1981, hardcover, 255 pages, OCLC: 8027928
- Miscevic, Dusanka and Peter Kwong, eds. Chinese Americans: The Immigrant Experience, (Hugh Lauter Levin Associates, 2000), 240 pages, ISBN 0-88363-128-8
- See, Lisa. On Gold Mountain: The One-Hundred-Year Odyssey of My Chinese American Family, (1996). ISBN 0-679-76852-1. See also the website for an exhibition based on this book Home Archived 4 April 2005 at the Wayback Machine from the Smithsonian Asian Pacific American Program.
- Song, Jingyi. Shaping and Reshaping Chinese American Identity: New York's Chinese during the Depression and World War II (2010)
- Tung, May Pao-May. Chinese Americans and Their Immigrant Parents: Conflict, Identity, and Values, Haworth Press, 2000.
- Wang, Ling-chi. "Chinese Americans." in Gale Encyclopedia of Multicultural America, edited by Thomas Riggs, (3rd ed., vol. 1, Gale, 2014), pp. 491–506. online Archived 26 March 2021 at the Wayback Machine
- Xu Guoqi. Chinese and Americans: A Shared History. Cambridge, MA: Harvard University Press, 2014.
- Young, Elliott. Alien Nation: Chinese Migration in the Americas from the Coolie Era through World War II. Chapel Hill, NC: University of North Carolina Press, 2014.
External links
- Factfinder Chinese Americans 2005 American Community Survey
- The Rocky Road to Liberty: A Documented History of Chinese American Immigration and Exclusion
- Museum of Chinese in the Americas
- Chinese Culture Center & Chinese Culture Foundation of San Francisco
- Organization of Chinese Americans Archived 12 April 2020 at the Wayback Machine
- Chinese Historical Society of America
- "Paper Son" – one Chinese American's story of coming to America under the Chinese Exclusion Act of 1882
- Becoming American: The Chinese Experience a PBS Bill Moyers special. Thomas F. Lennon, Series Producer.
- Chinese American Contribution to Transcontinental Railroad – Central Pacific Railroad Photographic History Museum
- Famous Chinese Americans Comprehensive list of famous Chinese Americans organized by professions. Includes short biographical notes and Chinese names.
- Chinese Information and Networking Association (CINA)
- The Yung Wing Project hosts the memoir of the first Chinese American graduate of an American university (Yale 1854).
- Chinese American Museum
- Documentary about the Golden Venture tragedy
- Americans and Chinese : purpose and fulfillment in great civilizations Archived 18 August 2014 at the Wayback Machine
| Central Asian |  | |
|---|---|---|
| East Asian | ||
| South Asian | ||
| Southeast Asian | ||
| Other | ||
| History | ||
| Topics | ||
| Regions | ||