Colonel William A. Phillips

Page contents not supported in other languages.

Original file(2,332 × 2,657 pixels, file size: 597 KB, MIME type: image/png)

This graph image could be re-created using vector graphics as an SVG file. This has several advantages; see Commons:Media for cleanup for more information. If an SVG form of this image is available, please upload it and afterwards replace this template with {{vector version available|new image name}}.


It is recommended to name the SVG file “2017- Donald Trump - graph - false or misleading claims.svg”—then the template Vector version available (or Vva) does not need the new image name parameter.

Summary

Description
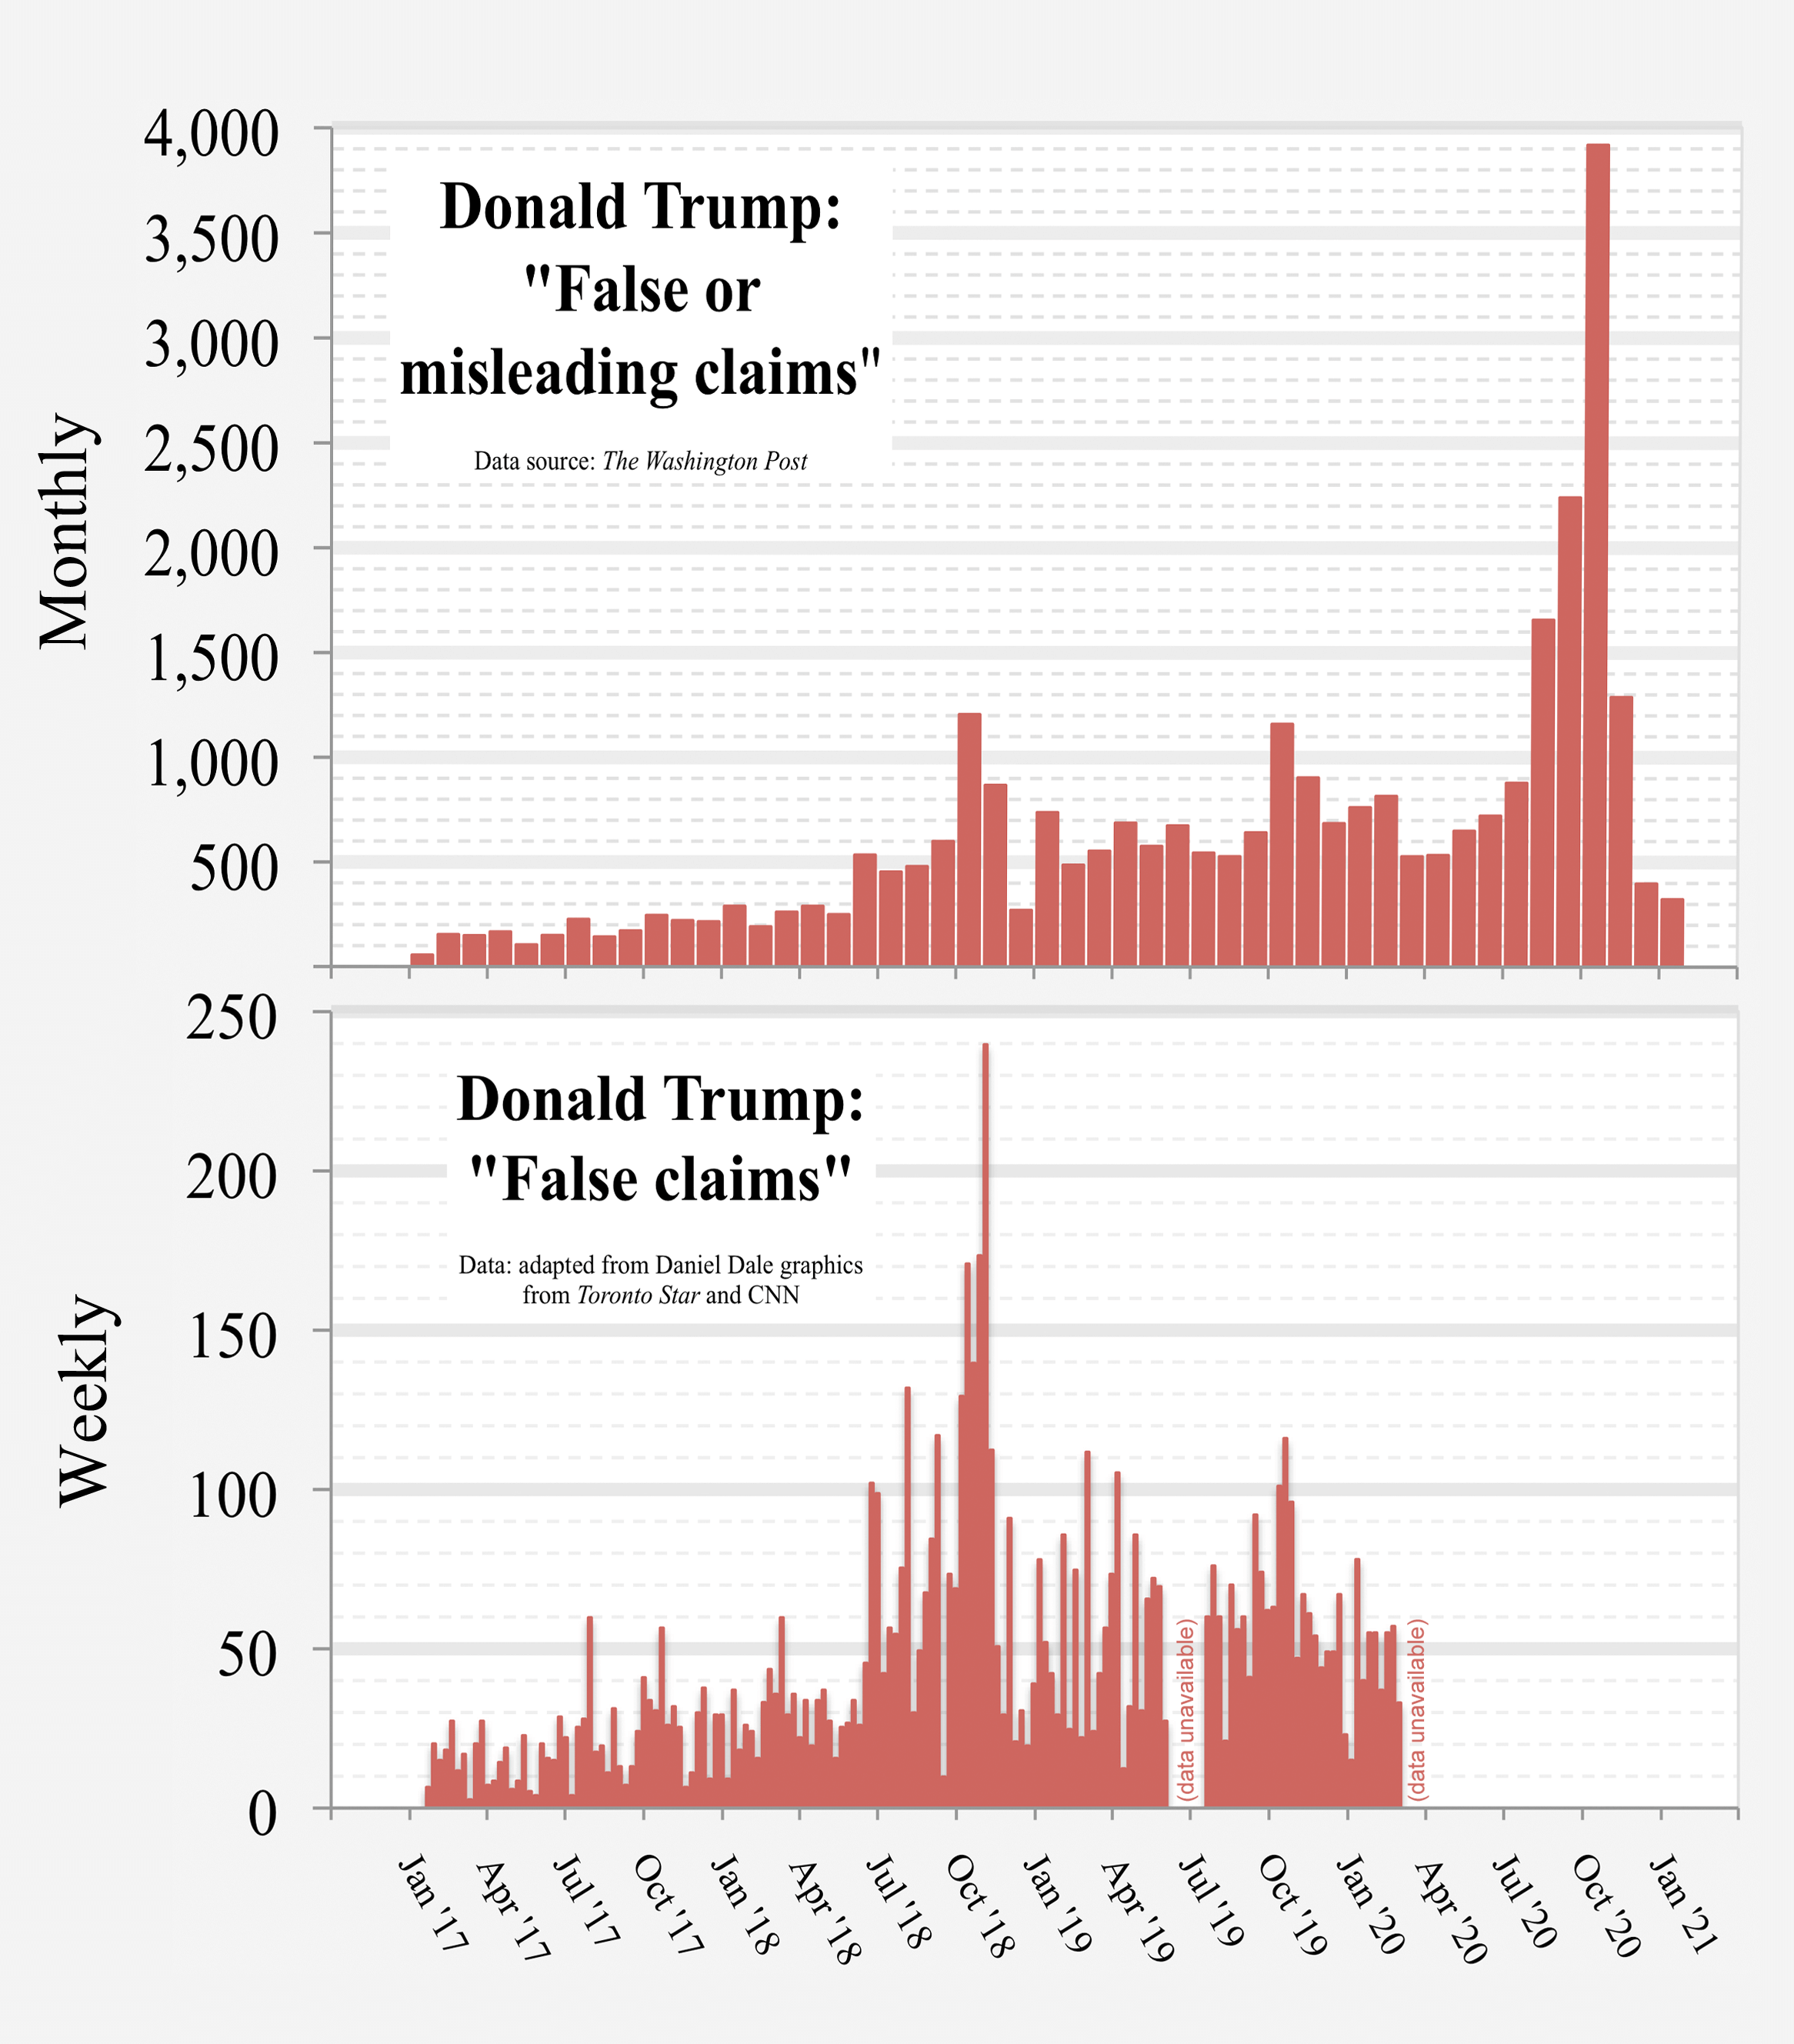
English: Charts showing findings of two newspapers' fact checkers re the number of "false or misleading" or "false" claims by U.S. President Donald Trump.


Data sources:

The Washington Post (upper chart)


Toronto Star and CNN (lower chart)


Related articles:

— apparently the reason I could not find an updated version of the Toronto Star fact check chart: fact-checker Daniel Dale moved to CNN:


Data:

  • Listings of actual data used to make the above two charts are provided in collapsible text below.
Date
Source Own work
Author RCraig09
Other versions
2017- Donald Trump veracity - composite graph.png

Consolidated data into a single graph

Data used to form the charts

Washington Post

Click at right to show/hide The Washington Post data

The Washington Post data:
Month False or misleading claims
2017-01 55
2017-02 153
2017-03 148
2017-04 166
2017-05 104
2017-06 149
2017-07 226
2017-08 142
2017-09 171
2017-10 245
2017-11 220
2017-12 215
2018-01 289
2018-02 191
2018-03 261
2018-04 289
2018-05 249
2018-06 534
2018-07 453
2018-08 479
2018-09 599
2018-10 1205
2018-11 867
2018-12 270
2019-01 737
2019-02 486
2019-03 553
2019-04 687
2019-05 576
2019-06 676
2019-07 545
2019-08 525
2019-09 639
(source was dated October 2019)
2019-10 1156
2019-11 900
(source dated December 2019)
2019-12 685
(source dated January 2020)
2020-01 761
2020-02 815
2020-03 527
(source dated April 2020)
2020-04 533
2020-05 649
2020-06 721
(source dated July 2020)
2020-07 873
2020-08 1651
2020-09 2213
(source dated Oct 16, 2020)
2020-10 3917
(source dated Nov 5, 2020)
2020-11 1286
2020-12 397
(source dated Jan 13, 2021)
2021-01 322
(source dated Jan 20, 2021)


Toronto Star and CNN data =

Click at right to show/hide data adapted from Toronto Star and CNN graphics

Data adapted by uploader from a Toronto Star graphic (is not the original data used to generate the newspaper's graphic):

Week False claims
2017-01-20 6
2017-01-27 20
2017-02-03 15
2017-02-10 18
2017-02-17 27
2017-02-24 12
2017-03-03 17
2017-03-10 3
2017-03-17 20
2017-03-24 27
2017-03-31 7
2017-04-07 8
2017-04-14 14
2017-04-21 19
2017-04-28 6
2017-05-05 8
2017-05-12 23
2017-05-19 5
2017-05-26 4
2017-06-02 20
2017-06-09 16
2017-06-16 15
2017-06-23 29
2017-06-30 22
2017-07-07 4
2017-07-14 25
2017-07-21 28
2017-07-28 60
2017-08-04 18
2017-08-11 19
2017-08-18 11
2017-08-25 31
2017-09-01 13
2017-09-08 7
2017-09-15 13
2017-09-22 24
2017-09-29 41
2017-10-06 34
2017-10-13 31
2017-10-20 56
2017-10-27 26
2017-11-03 32
2017-11-10 25
2017-11-17 6
2017-11-24 11
2017-12-01 30
2017-12-08 38
2017-12-15 9
2017-12-22 29
2017-12-29 29
2018-01-05 9
2018-01-12 37
2018-01-19 18
2018-01-26 26
2018-02-02 24
2018-02-09 16
2018-02-16 33
2018-02-23 44
2018-03-02 36
2018-03-09 60
2018-03-16 29
2018-03-23 36
2018-03-30 22
2018-04-06 34
2018-04-13 19
2018-04-20 34
2018-04-27 37
2018-05-04 27
2018-05-11 16
2018-05-18 25
2018-05-25 27
2018-06-01 34
2018-06-08 26
2018-06-15 45
2018-06-22 102
2018-06-29 99
2018-07-06 42
2018-07-13 56
2018-07-20 55
2018-07-27 75
2018-08-03 132
2018-08-10 30
2018-08-17 49
2018-08-24 68
2018-08-31 84
2018-09-07 117
2018-09-14 10
2018-09-21 73
2018-09-28 69
2018-10-05 129
2018-10-12 171
2018-10-19 140
2018-10-26 173
2018-11-02 240
2018-11-09 112
2018-11-16 51
2018-11-23 29
2018-11-30 91
2018-12-07 21
2018-12-14 31
2018-12-21 19
2018-12-28 39
2019-01-04 78
2019-01-11 52
2019-01-18 42
2019-01-25 29
2019-02-01 86
2019-02-08 25
2019-02-15 75
2019-02-22 22
2019-03-01 112
2019-03-08 24
2019-03-15 42
2019-03-22 56
2019-03-29 73
2019-04-05 105
2019-04-12 12
2019-04-19 32
2019-04-26 86
2019-05-03 31
2019-05-10 66
2019-05-17 72
2019-05-24 69
2019-05-31 27
(Toronto Star source was dated June 2019)

(data unavailable for June and early July)

2019-07-19 60
2019-07-26 76
2019-08-02 60
2019-08-09 21
2019-08-16 70
2019-08-23 56
2019-08-30 60
2019-09-06 41
2019-09-13 92
2019-09-20 74
2019-09-27 62
2019-10-04 63
2019-10-11 101
2019-10-18 116
2019-10-25 96
2019-11-01 47
2019-11-08 67
2019-11-15 61
2019-11-22 54
2019-11-29 44
2019-12-06 49
2019-12-13 49
2019-12-20 67
2019-12-27 23
2020-01-03 15
2020-01-10 78
2020-01-17 40
2020-01-24 55
2020-01-31 55
2020-02-07 37
2020-02-14 55
2020-02-21 57
2020-02-28 33

(CNN source was dated March 9, 2020)

Daniel Dale's (CNN) original source specified numbers daily; uploader added the values within each week to arrive at the foregoing weekly figures, with each week ending on a Friday to conform to Dale's earlier work at Toronto Star which also ended on Fridays.


Licensing

I, the copyright holder of this work, hereby publish it under the following license:
w:en:Creative Commons
attribution share alike
This file is licensed under the Creative Commons Attribution-Share Alike 4.0 International license.
You are free:
  • to share – to copy, distribute and transmit the work
  • to remix – to adapt the work
Under the following conditions:
  • attribution – You must give appropriate credit, provide a link to the license, and indicate if changes were made. You may do so in any reasonable manner, but not in any way that suggests the licensor endorses you or your use.
  • share alike – If you remix, transform, or build upon the material, you must distribute your contributions under the same or compatible license as the original.

Captions

Charts showing findings of two newspapers' fact checkers re the number of "false or misleading" or "false" claims by U.S. President Donald Trump.

Items portrayed in this file

depicts

Donald Trump

creator

some value

author name string: RCraig09
Wikimedia username: RCraig09

copyright status

copyrighted

copyright license

Creative Commons Attribution-ShareAlike 4.0 International

inception

5 November 2019

source of file

original creation by uploader

MIME type

image/png

checksum

ff2709b0d38428efde1f64c0113316060a5c613c

determination method: SHA-1

data size

611,681 byte

height

2,657 pixel

width

2,332 pixel

File history

Click on a date/time to view the file as it appeared at that time.

(newest | oldest) View (newer 10 | ) (10 | 20 | 50 | 100 | 250 | 500)
Date/TimeThumbnailDimensionsUserComment
current05:34, 9 February 2021Thumbnail for version as of 05:34, 9 February 20212,332 × 2,657 (597 KB)RCraig09Version 17: updating to include data for January 2021. Squaring off tops of columns and narrowing gaps between columns. Reduced filesize at tinypng.com
07:31, 16 January 2021Thumbnail for version as of 07:31, 16 January 20212,332 × 2,657 (560 KB)RCraig09Version 16: Adding datapoints for Nov and Dec 2020. Reducing PNG filesize at tinypng.com (reduces number of bits per pixel).
23:20, 5 January 2021Thumbnail for version as of 23:20, 5 January 20212,332 × 2,657 (1.64 MB)RCraig09Version 15: Update to include Washington Post date through end of October 2020.
23:20, 20 December 2020Thumbnail for version as of 23:20, 20 December 20202,332 × 2,657 (1.67 MB)RCraig09Version 14: Updated to include Washington Post data through end of September 2020.
07:21, 16 November 2020Thumbnail for version as of 07:21, 16 November 20202,332 × 2,657 (1.66 MB)RCraig09Version 13: Updating graph to include exact value for August 2020 that no longer involves extrapolation for the last four days of the month. Washington Post added a few more days to their database.
23:06, 21 October 2020Thumbnail for version as of 23:06, 21 October 20202,332 × 2,657 (1.66 MB)RCraig09Version 12: Updating to include July and August data from Washington Post. Top panel's vertical had to be compressed to accommodate new high in data value (for August 2020).
06:01, 13 July 2020Thumbnail for version as of 06:01, 13 July 20202,332 × 2,657 (1.43 MB)RCraig09Update to include Washington Post data through end of June 2020.
05:09, 5 June 2020Thumbnail for version as of 05:09, 5 June 20202,332 × 2,657 (1.49 MB)RCraig09Version 10: Update to include Washington Post data for April and May 2020
21:12, 15 April 2020Thumbnail for version as of 21:12, 15 April 20202,332 × 2,657 (1.77 MB)RCraig09Version 9: Updating with CNN Daniel Dale data for Jan and Feb 2020.
05:35, 15 April 2020Thumbnail for version as of 05:35, 15 April 20202,332 × 2,657 (1.83 MB)RCraig09Version 8: Adding "monthly" and "weekly" to vertical axes.
(newest | oldest) View (newer 10 | ) (10 | 20 | 50 | 100 | 250 | 500)

Global file usage

The following other wikis use this file: