


The geography of Tibet consists of the high mountains, lakes and rivers lying between Central, East and South Asia. Traditionally, Western (European and American) sources have regarded Tibet as being in Central Asia, though today's maps show a trend toward considering all of modern China, including Tibet, to be part of East Asia.[1][2][3] Tibet is often called "the roof of the world," comprising tablelands averaging over 4,950 metres above the sea with peaks at 6,000 to 7,500 m, including Mount Everest, on the border with Nepal.
Description
It is bounded on the north and east by the Central China Plain, on the west and south by the Indian subcontinent (Ladakh, Spiti and Sikkim in India, as well as Nepal and Bhutan). Most of Tibet sits atop a geological structure known as the Tibetan Plateau, which includes the Himalaya and many of the highest mountain peaks in the world.
High mountain peaks include Changtse, Lhotse, Makalu, Gauri Sankar, Gurla Mandhata, Cho Oyu, Jomolhari, Gyachung Kang, Gyala Peri, Mount Kailash, Kawagebo, Khumbutse, Melungtse, Mount Nyainqentanglha, Namcha Barwa, Shishapangma and Yangra. Mountain passes include Cherko la and North Col. Smaller mountains include Mount Gephel and Gurla Mandhata.
Regions
Physically, Tibet may be divided into two parts, the "lake region" in the west and north-west, and the "river region", which spreads out on three sides of the former on the east, south, and west.[4] The region names are useful in contrasting their hydrological structures, and also in contrasting their different cultural uses which is nomadic in the "lake region" and agricultural in the "river region".[5] Despite its large size and mountainous nature, variation of climate across the Tibetan Plateau is more steady than abrupt. The "river region" has a subtropical highland climate with moderate summer rainfall averaging around 500 millimetres (20 in) per year, and daytime temperatures ranging from around 7 °C (45 °F) in winter to 24 °C (75 °F) in summer – though nights are as much as 15 °C (27 °F) cooler. Rainfall decreases steadily to the west, reaching only 110 millimetres (4.3 in) at Leh on the edge of this region, whilst temperatures in winter become steadily colder. On the south the "river region" is bounded by the Himalayas, on the north by a broad mountain system. The system at no point narrows to a single range; generally there are three or four across its breadth. As a whole the system forms the watershed between rivers flowing to the Indian Ocean – the Indus, Brahmaputra and Salween and its tributaries – and the streams flowing into the undrained salt lakes to the north.[4]
The "river region" is characterized by fertile mountain valleys and includes the Yarlung Tsangpo River (the upper courses of the Brahmaputra) and its major tributary, the Nyang River, the Salween, the Yangtze, the Mekong, and the Yellow River. The Yarlung Tsangpo Canyon, formed by a horseshoe bend in the river where it flows around Namcha Barwa, is the deepest, and possibly longest canyon in the world.[6] Among the mountains there are many narrow valleys. The valleys of Lhasa, Shigatse, Gyantse and the Brahmaputra are free from permafrost, covered with good soil and groves of trees, well irrigated, and richly cultivated.[4]
The South Tibet Valley is formed by the Yarlung Zangbo River during its middle reaches, where it travels from west to east. The valley is approximately 1200 kilometers long and 300 kilometers wide. The valley descends from 4500 meters above sea level to 2800 meters. The mountains on either side of the valley are usually around 5000 meters high.[7][8] Lakes here include Lake Paiku and Lake Puma Yumco.
The "lake region" extends from the Pangong Tso Lake in Ladakh, Lake Rakshastal, Yamdrok Lake and Lake Manasarovar near the source of the Indus River, to the sources of the Salween, the Mekong and the Yangtze. Other lakes include Dagze Co, Nam Co, and Pagsum Co. The lake region is an arid and wind-swept desert. This region is called the Chang Tang (Byang thang) or 'Northern Plateau' by the people of Tibet. It is some 1100 km (700 mi) broad, and covers an area about equal to that of France. Due to the extremely high mountain barriers it has a very arid alpine climate with annual precipitation around 100 millimetres (4 in) and possesses no river outlet. The mountain ranges are spread out, rounded, disconnected, separated by flat valleys. The country is dotted over with large and small lakes, generally salt or alkaline, and intersected by streams. Due to the presence of discontinuous permafrost over the Chang Tang, the soil is boggy and covered with tussocks of grass, thus resembling the Siberian tundra. Salt and fresh-water lakes are intermingled. The lakes are generally without outlet, or have only a small effluent. The deposits consist of soda, potash, borax and common salt. The lake region is noted for a vast number of hot springs, which are widely distributed between the Himalaya and 34° N., but are most numerous to the west of Tengri Nor (north-west of Lhasa). So intense is the cold in this part of Tibet that these springs are sometimes represented by columns of ice, the nearly boiling water having frozen in the act of ejection.[4]
Climate
The climate of Tibet is severely dry nine months of the year, and average annual snowfall is only 46 cm (18 inches), due to the rain shadow effect. Western passes receive small amounts of fresh snow each year but remain traversible all year round. Low temperatures are prevalent throughout these western regions, where bleak desolation is unrelieved by any vegetation bigger than a low bush, and where the wind sweeps unchecked across vast expanses of arid plain. The Indian monsoon exerts some influence on eastern Tibet. Northern Tibet is subject to high temperatures in the summer and intense cold in the winter.[4]
Climate data
| Climate data for Lhasa (Köppen BSk/Dwb/Cwb) | |||||||||||||
|---|---|---|---|---|---|---|---|---|---|---|---|---|---|
| Month | Jan | Feb | Mar | Apr | May | Jun | Jul | Aug | Sep | Oct | Nov | Dec | Year |
| Record high °C (°F) | 20.5 (68.9) |
21.3 (70.3) |
25.1 (77.2) |
25.9 (78.6) |
29.4 (84.9) |
30.8 (87.4) |
30.4 (86.7) |
27.2 (81.0) |
26.5 (79.7) |
24.8 (76.6) |
22.8 (73.0) |
20.1 (68.2) |
30.8 (87.4) |
| Mean daily maximum °C (°F) | 8.4 (47.1) |
10.1 (50.2) |
13.3 (55.9) |
16.3 (61.3) |
20.5 (68.9) |
24.0 (75.2) |
23.3 (73.9) |
22.0 (71.6) |
20.7 (69.3) |
17.5 (63.5) |
12.9 (55.2) |
9.3 (48.7) |
16.5 (61.7) |
| Daily mean °C (°F) | −0.3 (31.5) |
2.3 (36.1) |
5.9 (42.6) |
9.0 (48.2) |
13.1 (55.6) |
16.7 (62.1) |
16.5 (61.7) |
15.4 (59.7) |
13.8 (56.8) |
9.4 (48.9) |
3.8 (38.8) |
−0.1 (31.8) |
8.8 (47.8) |
| Mean daily minimum °C (°F) | −7.4 (18.7) |
−4.7 (23.5) |
−0.8 (30.6) |
2.7 (36.9) |
6.8 (44.2) |
10.9 (51.6) |
11.4 (52.5) |
10.7 (51.3) |
8.9 (48.0) |
3.1 (37.6) |
−3 (27) |
−6.8 (19.8) |
2.7 (36.8) |
| Record low °C (°F) | −16.5 (2.3) |
−15.4 (4.3) |
−13.6 (7.5) |
−8.1 (17.4) |
−2.7 (27.1) |
2.0 (35.6) |
4.5 (40.1) |
3.3 (37.9) |
0.3 (32.5) |
−7.2 (19.0) |
−11.2 (11.8) |
−16.1 (3.0) |
−16.5 (2.3) |
| Average precipitation mm (inches) | 0.9 (0.04) |
1.8 (0.07) |
2.9 (0.11) |
8.6 (0.34) |
28.4 (1.12) |
75.9 (2.99) |
129.6 (5.10) |
133.5 (5.26) |
66.7 (2.63) |
8.8 (0.35) |
0.9 (0.04) |
0.3 (0.01) |
458.3 (18.06) |
| Average precipitation days (≥ 0.1 mm) | 0.6 | 1.2 | 2.1 | 5.4 | 9.0 | 14.0 | 19.4 | 19.9 | 14.6 | 4.1 | 0.6 | 0.4 | 91.3 |
| Average relative humidity (%) | 26 | 25 | 27 | 36 | 41 | 48 | 59 | 63 | 59 | 45 | 34 | 29 | 41 |
| Mean monthly sunshine hours | 250.9 | 231.2 | 253.2 | 248.8 | 280.4 | 260.7 | 227.0 | 214.3 | 232.7 | 280.3 | 267.1 | 257.2 | 3,003.8 |
| Percent possible sunshine | 78 | 72 | 66 | 65 | 66 | 61 | 53 | 54 | 62 | 80 | 84 | 82 | 67 |
| Source 1: China Meteorological Administration,[9] all-time extreme temperature[10][11] | |||||||||||||
| Source 2: China Meteorological Administration National Meteorological Information Center | |||||||||||||
| Climate data for Shigatse (Köppen Dwb) | |||||||||||||
|---|---|---|---|---|---|---|---|---|---|---|---|---|---|
| Month | Jan | Feb | Mar | Apr | May | Jun | Jul | Aug | Sep | Oct | Nov | Dec | Year |
| Mean daily maximum °C (°F) | 5.6 (42.1) |
7.9 (46.2) |
10.9 (51.6) |
15.2 (59.4) |
18.9 (66.0) |
22.2 (72.0) |
20.8 (69.4) |
19.7 (67.5) |
18.5 (65.3) |
15.1 (59.2) |
10.3 (50.5) |
6.8 (44.2) |
14.3 (57.8) |
| Daily mean °C (°F) | −3.7 (25.3) |
−0.8 (30.6) |
2.8 (37.0) |
7.3 (45.1) |
11.0 (51.8) |
14.9 (58.8) |
14.7 (58.5) |
13.9 (57.0) |
12.1 (53.8) |
6.9 (44.4) |
1.0 (33.8) |
−2.7 (27.1) |
6.5 (43.6) |
| Mean daily minimum °C (°F) | −13.0 (8.6) |
−9.4 (15.1) |
−5.3 (22.5) |
−0.7 (30.7) |
3.2 (37.8) |
7.6 (45.7) |
8.7 (47.7) |
8.1 (46.6) |
5.7 (42.3) |
−1.2 (29.8) |
−8.3 (17.1) |
−12.2 (10.0) |
−1.4 (29.5) |
| Average precipitation mm (inches) | 0 (0) |
0 (0) |
2 (0.1) |
3 (0.1) |
15 (0.6) |
60 (2.4) |
129 (5.1) |
146 (5.7) |
58 (2.3) |
7 (0.3) |
2 (0.1) |
0 (0) |
422 (16.7) |
| Source: Climate-Data.org [12] | |||||||||||||
| Climate data for Leh, India (Köppen BWk) | |||||||||||||
|---|---|---|---|---|---|---|---|---|---|---|---|---|---|
| Month | Jan | Feb | Mar | Apr | May | Jun | Jul | Aug | Sep | Oct | Nov | Dec | Year |
| Record high °C (°F) | 8.3 (46.9) |
12.8 (55.0) |
19.4 (66.9) |
23.9 (75.0) |
28.9 (84.0) |
34.8 (94.6) |
34.0 (93.2) |
34.2 (93.6) |
30.6 (87.1) |
25.6 (78.1) |
20.0 (68.0) |
12.8 (55.0) |
34.8 (94.6) |
| Mean daily maximum °C (°F) | −2.0 (28.4) |
1.5 (34.7) |
6.5 (43.7) |
12.3 (54.1) |
16.2 (61.2) |
21.8 (71.2) |
25.0 (77.0) |
25.3 (77.5) |
21.7 (71.1) |
14.6 (58.3) |
7.9 (46.2) |
2.3 (36.1) |
12.8 (55.0) |
| Mean daily minimum °C (°F) | −14.4 (6.1) |
−11.0 (12.2) |
−5.9 (21.4) |
−1.1 (30.0) |
3.2 (37.8) |
7.4 (45.3) |
10.5 (50.9) |
10.0 (50.0) |
5.8 (42.4) |
−1.0 (30.2) |
−6.7 (19.9) |
−11.8 (10.8) |
−1.3 (29.7) |
| Record low °C (°F) | −28.3 (−18.9) |
−26.4 (−15.5) |
−19.4 (−2.9) |
−12.8 (9.0) |
−4.4 (24.1) |
−1.1 (30.0) |
0.6 (33.1) |
1.5 (34.7) |
−4.4 (24.1) |
−8.5 (16.7) |
−17.5 (0.5) |
−25.6 (−14.1) |
−28.3 (−18.9) |
| Average rainfall mm (inches) | 9.5 (0.37) |
8.1 (0.32) |
11.0 (0.43) |
9.1 (0.36) |
9.0 (0.35) |
3.5 (0.14) |
15.2 (0.60) |
15.4 (0.61) |
9.0 (0.35) |
7.5 (0.30) |
3.6 (0.14) |
4.6 (0.18) |
105.5 (4.15) |
| Average rainy days | 1.3 | 1.1 | 1.3 | 1.0 | 1.1 | 0.4 | 2.1 | 1.9 | 1.2 | 0.4 | 0.5 | 0.7 | 13.0 |
| Average relative humidity (%) (at 17:30 IST) | 51 | 51 | 46 | 36 | 30 | 26 | 33 | 34 | 31 | 27 | 40 | 46 | 38 |
| Source: India Meteorological Department[13][14] | |||||||||||||
The effects of climate change
The Tibetan Plateau contains the world's third-largest store of ice. Qin Dahe, the former head of the China Meteorological Administration, said that the recent fast pace of melting and warmer temperatures will be good for agriculture and tourism in the short term; but issued a strong warning:
"Temperatures are rising four times faster than elsewhere in China, and the Tibetan glaciers are retreating at a higher speed than in any other part of the world." "In the short term, this will cause lakes to expand and bring floods and mudflows." "In the long run, the glaciers are vital lifelines for Asian rivers, including the Indus and the Ganges. Once they vanish, water supplies in those regions will be in peril."[15]
Tibet during the last glacial period
Today Tibet is the most essential heating surface of the atmosphere. During the Last glacial period a c. 2,400,000 square kilometres (930,000 sq mi) ice sheet covered the plateau.[16] This glaciation took place in correspondence to a lowering of the snowline by 1,200 metres (3,900 ft). For the Last Glacial Maximum this means a depression of the average annual temperature by 7 to 8 °C (13 to 14 °F) at a minor precipitation compared with that one of today.
Owing to this drop in temperature a supposed drier climate has partly been compensated with regard to the glacier feeding by a minor evaporation and an increased relative humidity. Due to its great extension this glaciation in the subtropics was the most important climatically foreign element on earth. With an albedo about 80-90% this ice area of Tibet has reflected an at least 4 times greater global radiation energy per surface into space than the further inland ices at a higher geographical latitude. At that time the most essential heating surface of the atmosphere – which at present, i.e. interglacially, is the Tibetan plateau – was the most important cooling surface.[17]
The annual low-pressure area induced by heat above Tibet as a motor of the summer monsoon was lacking. The glaciation thus caused a breaking-off of the summer monsoon with all the global-climatic consequences, e.g. the pluvials in the Sahara, the expansion of the Thar desert, the heavier dust influx into the Arabian Sea etc., and also the downward shifting of the timber line and all forest-belts from the alpine-boreal forests as far down as to the semi-humid mediterranean forest which has replaced the Holocene monsoon-tropical forests on the Indian subcontinent. But also the movements of animals including the Javan Rusa far into South Asia are a consequence of this glaciation.
Despite heavy ablation caused by heavy insolation, the discharge of the glaciers into the Inner-Asian basins was sufficient for the creation of meltwater lakes in the Qaidam Basin, the Tarim Basin and the Gobi Desert. The drop in temperature (see above) was in favour of their development. Thus, the clay fraction produced by the ground scouring of the important glaciation was ready to be blown-out. The blow-out of the limnites and the Aeolian long-distance transport were connected to the katabatic winds. Accordingly, the Tibetan glaciation was the actual cause of the enormous loess production and the transport of the material into the Chinese middle- and lowlands continuing to the east.[18] During the Ice Age the katabatic air current – the name 'winter monsoon' is not quite correct – blew all year round.
The enormous uplift of Tibet by around 10 mm/year measured by triangulations since the 19th century and confirmed by glaciogemorphological findings as well as by seismological investigations equals the uplift of the Himalaya. However, these amounts of uplift are far too important as to a primarily tectonic uplift of the high plateau which only takes place epirogenetically. Actually they can be understood the better by a superimposed glacioisostatic compensation movement of Tibet about 650 m.[19]
An alternative view held by some scientists[20] is that the glaciers on the Tibetan Plateau have remained restricted over the entire data published since 1974 in the literature referred to in Kuhle (2004),[21] which are relevant as to the maximum ice extent.
-

-
 Tibet is located on the Tibetan Plateau, the world's highest region.
 -
![Tibetan Plateau and surrounding areas above 1600-m topography[22][23]](https://upload.wikimedia.org/wikipedia/commons/thumb/b/bd/Tibet_and_surrounding_areas_topographic_map_2.png/289px-Tibet_and_surrounding_areas_topographic_map_2.png)
-
 The Tibetan plateau lies between the Himalayan range to the south and the Taklamakan plain to the north.
 -
 Lake Pangong Tso
 -
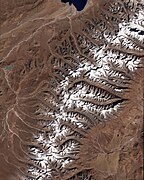 Glacier-capped mountains in Tibet
 -
Animation of glacier-capped mountains in Tibet


![Tibetan Plateau and surrounding areas above 1600-m topography[22][23]](http://oksuvcw.org/?page_id=179&rdp_we_resource=https%3A%2F%2Fen.wikipedia.org%2Fwiki%2FFile%3ATibet_and_surrounding_areas_topographic_map_2.png)


See also
Notes
- ^ "plateaus". Archived from the original on January 11, 2008.
- ^ "East Asia Region".
- ^ "UNESCO Collection of History of Civilizations of Central Asia Volume IV". Retrieved 2009-02-19.
- ^ a b c d e Waddell & Holdich 1911, p. 917.
- ^ "Tibet: Agricultural Regions". Archived from the original on 2007-08-24. Retrieved 2007-08-06.
- ^ "The World's Biggest Canyon". www.china.org. Retrieved 2007-06-29.
- ^ Yang Qinye and Zheng Du (2004). Tibetan Geography. China Intercontinental Press. pp. 30–31. ISBN 7-5085-0665-0.
- ^ Zheng Du, Zhang Qingsong, Wu Shaohong: Mountain Geography and Sustainable Development of the Tibetan Plateau (Kluwer 2000), ISBN 0-7923-6688-3, p. 312;
- ^ 中国地面国际交换站气候标准值月值数据集(1971-2000年) (in Chinese). China Meteorological Administration. Archived from the original on October 16, 2013. Retrieved 2010-05-04.
- ^ "Extreme Temperatures Around the World". Retrieved 2013-02-21.
- ^ "55591: Lhasa (China)". ogimet.com. OGIMET. 28 March 2022. Retrieved 29 March 2022.
- ^ "Climate: Shigatse - Climate-Data.org". Archived from the original on 22 January 2018. Retrieved 21 January 2018.
- ^ "Leh Climatological Table Period: 1951–1980". India Meteorological Department. Archived from the original on 25 February 2018. Retrieved April 11, 2015.
- ^ "Leh Climatological Table Period: 1951–1980". India Meteorological Department. Archived from the original on 21 July 2011. Retrieved April 4, 2020.
- ^ Global warming benefits to Tibet: Chinese official. Reported 18/Aug/2009.
- ^ Matthias Kuhle (1997): New Findings concerning the Ice Age (Last Glacial Maximum) Glacier Cover of the East-Pamir, of the Nanga Parbat up to the Central Himalaya and of Tibet, as well as the Age of the Tibetan Inland Ice. GeoJournal 42 (2-3, Tibet and High Asia IV. Results of Investigations into High Mountain Geomorphology, Paleo- Glaciology and Climatology of the Pleistocene (Ice Age Research)), 87-257.
- ^ Matthias Kuhle (2011): Ice Age Development Theory. In: Encyclopedia of Snow, Ice and Glaciers. Eds: V. P. Singh, P. Singh, U. K. Haritashya, 576-581, Springer.
- ^ Matthias Kuhle (2001): The Tibetan Ice Sheet; its Impact on the Palaeomonsoon and Relation to the Earth's Orbital Variations. Polarforschung 71 (1/2), 1-13.
- ^ Matthias Kuhle (1995): Glacial Isostatic Uplift of Tibet as a Consequence of a Former Ice Sheet. GeoJournal 37 (4), 431-449.
- ^ Lehmkuhl, F., Owen, L.A. (2005): Late Quaternary glaciation of Tibet and the bordering mountains: a review. Boreas, 34, 87-100.
- ^ Matthias Kuhle (2004): The High Glacial (Last Ice Age and LGM) ice cover in High and Central Asia. Development in Quaternary Science 2c (Quaternary Glaciation - Extent and Chronology, Part III: South America, Asia, Africa, Australia, Antarctica, Eds: Ehlers, J.; Gibbard, P.L.), 175-199.
- ^ National Geophysical Data Center, 1999. Global Land One-kilometer Base Elevation (GLOBE) v.1. Hastings, D. and P.K. Dunbar. National Geophysical Data Center, NOAA. doi:10.7289/V52R3PMS [access date: 2015-03-16]
- ^ Amante, C. and B.W. Eakins, 2009. ETOPO1 1 Arc-Minute Global Relief Model: Procedures, Data Sources and Analysis. NOAA Technical Memorandum NESDIS NGDC-24. National Geophysical Data Center, NOAA. doi:10.7289/V5C8276M [access date: 2015-03-18].
- This article incorporates text from a publication now in the public domain: Waddell, Lawrence Austine; Holdich, Thomas Hungerford (1911). "Tibet". In Chisholm, Hugh (ed.). Encyclopædia Britannica. Vol. 26 (11th ed.). Cambridge University Press. pp. 916–917.
References
- Hopkirk, Peter. Trespassers on the Roof of the World: The Secret Exploration of Tibet (1983) J. P. Tarcher. ISBN 0-87477-257-5
External links
- Online collection of maps of Tibet maintained by The Australian National University
- Geography of Tibet
- Full Map of Tibet from 1904