

St. Francis County is a county in the U.S. state of Arkansas. As of the 2020 census, the population was 23,090.[1] The county seat is Forrest City.[2]
St. Francis County comprises the Forrest City, Arkansas Micropolitan Statistical Area, which is also included in the Memphis-Forrest City, TN-MS-AR Combined Statistical Area.
History
St. Francis County was formed by the Arkansas territorial legislature on October 13, 1827. Madison served as the county seat until Forrest City, formed in 1869 and named after Nathan Bedford Forrest, replaced it in 1874.[3]
The percentage of tenant farmers in the county rose from 43.2% in 1880 to 70.7% in 1900.[4]
It is on the eastern border of the state in the Arkansas Delta, formed by the lowlands of the Mississippi River. It was an area of large cotton plantations in the antebellum era, when the workers were enslaved African Americans. It continued as an agricultural area into the late 19th century, when many freedmen became sharecroppers.
Geography
According to the U.S. Census Bureau, the county has a total area of 643 square miles (1,670 km2), of which 635 square miles (1,640 km2) is land and 7.7 square miles (20 km2) (1.2%) is water.[5]
Major highways
Adjacent counties
- Cross County (north)
- Crittenden County (east)
- Lee County (south)
- Monroe County (southwest)
- Woodruff County (northwest)
Demographics
| Census | Pop. | Note | %± |
|---|---|---|---|
| 1830 | 1,505 | — | |
| 1840 | 2,499 | 66.0% | |
| 1850 | 4,479 | 79.2% | |
| 1860 | 8,672 | 93.6% | |
| 1870 | 6,714 | −22.6% | |
| 1880 | 8,389 | 24.9% | |
| 1890 | 13,543 | 61.4% | |
| 1900 | 17,157 | 26.7% | |
| 1910 | 22,548 | 31.4% | |
| 1920 | 28,385 | 25.9% | |
| 1930 | 33,394 | 17.6% | |
| 1940 | 36,043 | 7.9% | |
| 1950 | 36,841 | 2.2% | |
| 1960 | 33,303 | −9.6% | |
| 1970 | 30,799 | −7.5% | |
| 1980 | 30,858 | 0.2% | |
| 1990 | 28,497 | −7.7% | |
| 2000 | 29,329 | 2.9% | |
| 2010 | 28,258 | −3.7% | |
| 2020 | 23,090 | −18.3% | |
| 2023 (est.) | 22,101 | [6] | −4.3% |
| U.S. Decennial Census[7] 1790–1960[8] 1900–1990[9] 1990–2000[10] 2010[11] | |||
2020 census
| Race | Num. | Perc. |
|---|---|---|
| White | 9,206 | 39.87% |
| Black or African American | 12,501 | 54.14% |
| Native American | 65 | 0.28% |
| Asian | 122 | 0.53% |
| Pacific Islander | 1 | 0.01% |
| Other/Mixed | 510 | 2.21% |
| Hispanic or Latino | 686 | 2.97% |
As of the 2020 United States Census, there were 23,090 people, 9,388 households, and 5,867 families residing in the county.
2010 census
As of the 2010 census, there were 28,258 people living in the county. 51.9% were Black or African American, 44.2% White, 0.5% Native American, 0.5% Asian, 1.4% of some other race and 1.5% of two or more races. 4.1% were Hispanic or Latino (of any race).
2000 census

As of the 2000 census,[14] there were 29,329 people, 10,043 households, and 7,230 families living in the county. The population density was 18/km2 (47/sq mi). There were 11,242 housing units at an average density of 7/km2 (18/sq mi). The racial makeup of the county was 48.36% White, 49.01% Black or African American, 0.25% Native American, 0.56% Asian, 0.02% Pacific Islander, 0.40% from other races, and 1.40% from two or more races. 4.88% of the population were Hispanic or Latino of any race.
There were 10,043 households, out of which 35.30% had children under the age of 18 living with them, 46.90% were married couples living together, 20.80% had a female householder with no husband present, and 28.00% were non-families. 25.10% of all households were made up of individuals, and 10.80% had someone living alone who was 65 years of age or older. The average household size was 2.65 and the average family size was 3.17.
In the county, the population was spread out, with 27.90% under the age of 18, 9.90% from 18 to 24, 29.10% from 25 to 44, 21.20% from 45 to 64, and 11.90% who were 65 years of age or older. The median age was 34 years. For every 100 females there were 105.60 males. For every 100 females age 18 and over, there were 105.40 males.
The median income for a household in the county was $26,146, and the median income for a family was $30,324. Males had a median income of $28,389 versus $20,578 for females. The per capita income for the county was $12,483. About 23.10% of families and 27.50% of the population were below the poverty line, including 38.70% of those under age 18 and 23.10% of those age 65 or over.
Government and politics
The Republican Party and Union Labor Party merged for the 1888 election and nominated a multiracial slate of candidates against the all-white Democratic slate. On September 4, Paul M. Cobbs, a white Democrat, shot at men guarding the precinct ballot box and wounded seven. The Republican-Union Labor ticket won the county elections.[15] The Union Labor Party's gubernatorial and Arkansas's 1st congressional district candidates also won St. Francis County.[16]
The Federal Bureau of Prisons Federal Correctional Complex, Forrest City is in Forrest City.[17][18]
A portion of St. Francis County is represented in the Arkansas State Senate by Republican Ronald R. Caldwell.
In presidential elections, St. Francis County generally votes Democratic. Following Reconstruction and disenfranchisement of black voters at the turn of the century, the county voted Democratic in every election since 1896, other than 1900 (William McKinley), 1908 (William Howard Taft), and 1968 (George Wallace).
By the late 1960s, white conservatives began to shift into the Republican Party, and St. Francis County was carried by Richard Nixon in 1972 amidst a national landslide. In 1984, Ronald Reagan carried the county in his landslide reelection. The county has voted Democratic in every subsequent presidential election, albeit be narrowing margins in recent years.
| Year | Republican | Democratic | Third party | |||
|---|---|---|---|---|---|---|
| No. | % | No. | % | No. | % | |
| 2020 | 3,242 | 45.61% | 3,604 | 50.70% | 262 | 3.69% |
| 2016 | 3,195 | 43.00% | 4,031 | 54.25% | 204 | 2.75% |
| 2012 | 3,368 | 40.28% | 4,910 | 58.72% | 84 | 1.00% |
| 2008 | 3,917 | 41.21% | 5,486 | 57.72% | 102 | 1.07% |
| 2004 | 3,815 | 39.79% | 5,684 | 59.28% | 89 | 0.93% |
| 2000 | 3,414 | 40.18% | 4,986 | 58.69% | 96 | 1.13% |
| 1996 | 2,523 | 29.19% | 5,562 | 64.35% | 559 | 6.47% |
| 1992 | 3,289 | 30.93% | 6,548 | 61.57% | 798 | 7.50% |
| 1988 | 4,298 | 47.86% | 4,656 | 51.85% | 26 | 0.29% |
| 1984 | 5,378 | 52.10% | 4,866 | 47.14% | 78 | 0.76% |
| 1980 | 4,485 | 42.77% | 5,816 | 55.46% | 186 | 1.77% |
| 1976 | 3,639 | 34.59% | 6,851 | 65.12% | 30 | 0.29% |
| 1972 | 5,692 | 65.95% | 2,674 | 30.98% | 265 | 3.07% |
| 1968 | 1,608 | 17.58% | 3,284 | 35.91% | 4,254 | 46.51% |
| 1964 | 3,377 | 47.98% | 3,651 | 51.88% | 10 | 0.14% |
| 1960 | 1,786 | 39.53% | 2,432 | 53.83% | 300 | 6.64% |
| 1956 | 1,884 | 44.87% | 2,114 | 50.35% | 201 | 4.79% |
| 1952 | 1,792 | 42.08% | 2,466 | 57.90% | 1 | 0.02% |
| 1948 | 178 | 8.26% | 1,011 | 46.91% | 966 | 44.83% |
| 1944 | 446 | 21.16% | 1,654 | 78.46% | 8 | 0.38% |
| 1940 | 192 | 10.14% | 1,671 | 88.23% | 31 | 1.64% |
| 1936 | 94 | 4.59% | 1,938 | 94.72% | 14 | 0.68% |
| 1932 | 130 | 5.49% | 2,191 | 92.56% | 46 | 1.94% |
| 1928 | 617 | 30.82% | 1,376 | 68.73% | 9 | 0.45% |
| 1924 | 433 | 29.52% | 972 | 66.26% | 62 | 4.23% |
| 1920 | 903 | 40.82% | 1,252 | 56.60% | 57 | 2.58% |
| 1916 | 395 | 29.15% | 960 | 70.85% | 0 | 0.00% |
| 1912 | 296 | 29.19% | 563 | 55.52% | 155 | 15.29% |
| 1908 | 755 | 51.12% | 619 | 41.91% | 103 | 6.97% |
| 1904 | 577 | 43.29% | 737 | 55.29% | 19 | 1.43% |
| 1900 | 703 | 51.84% | 634 | 46.76% | 19 | 1.40% |
| 1896 | 455 | 29.35% | 1,087 | 70.13% | 8 | 0.52% |
Communities
Cities
- Forrest City (county seat)
- Madison
Towns
Townships

Townships in Arkansas are the divisions of a county. Each township includes unincorporated areas; some may have incorporated cities or towns within part of their boundaries. Arkansas townships have limited purposes in modern times. However, the United States census does list Arkansas population based on townships (sometimes referred to as "county subdivisions" or "minor civil divisions"). Townships are also of value for historical purposes in terms of genealogical research. Each town or city is within one or more townships in an Arkansas county based on census maps and publications. The townships of St. Francis County are listed below; listed in parentheses are the cities, towns, and/or census-designated places that are fully or partially inside the township.[20][21]
- Black Fish
- Franks (small part of Forrest City)
- Garland (Hughes)
- Goodwin
- Griggs (Widener)
- Heth
- Johnson
- L'Anguille
- Madison (most of Forrest City, Madison
- Prairie (Palestine)
- Telico (Caldwell, Colt, small part of Forrest City)
- Wheatley (most of Wheatley)
Education
School districts include:[22]
Former school districts:[23]
Notable people
- Al Green, soul singer
- Charlie Rich, country singer
- Sonny Liston, world heavyweight boxing champion
- Mark R. Martin, Secretary of State of Arkansas
See also
- List of lakes in St. Francis County, Arkansas
- National Register of Historic Places listings in St. Francis County, Arkansas
References
- ^ "Census - Geography Profile: St. Francis County, Arkansas". United States Census Bureau. Retrieved January 21, 2023.
- ^ "Find a County". National Association of Counties. Retrieved June 7, 2011.
- ^ Welch 2001, p. 360-362.
- ^ Welch 2001, p. 362.
- ^ "2010 Census Gazetteer Files". United States Census Bureau. August 22, 2012. Retrieved August 27, 2015.
- ^ "Annual Estimates of the Resident Population for Counties: April 1, 2020 to July 1, 2023". United States Census Bureau. Retrieved March 30, 2024.
- ^ "U.S. Decennial Census". United States Census Bureau. Retrieved August 27, 2015.
- ^ "Historical Census Browser". University of Virginia Library. Retrieved August 27, 2015.
- ^ Forstall, Richard L., ed. (March 27, 1995). "Population of Counties by Decennial Census: 1900 to 1990". United States Census Bureau. Retrieved August 27, 2015.
- ^ "Census 2000 PHC-T-4. Ranking Tables for Counties: 1990 and 2000" (PDF). United States Census Bureau. April 2, 2001. Archived (PDF) from the original on March 27, 2010. Retrieved August 27, 2015.
- ^ "State & County QuickFacts". United States Census Bureau. Archived from the original on August 13, 2011. Retrieved May 19, 2014.
- ^ "Explore Census Data". data.census.gov. Retrieved December 7, 2021.
- ^ Based on 2000 census data
- ^ "U.S. Census website". United States Census Bureau. Retrieved May 14, 2011.
- ^ Welch 2001, p. 365-370.
- ^ Hild 2004, p. 36.
- ^ "Forrest City city, Arkansas[permanent dead link]." U.S. Census Bureau. Retrieved on May 1, 2011.
- ^ "FCI Forrest City Medium Contact Information." Federal Bureau of Prisons. Retrieved on May 1, 2011. "FCI FORREST CITY MEDIUM FEDERAL CORRECTIONAL INSTITUTION 1400 DALE BUMPERS ROAD FORREST CITY, AR 72335"
- ^ "Dave Leip's Atlas of U.S. Presidential Elections". Retrieved November 18, 2016.
- ^ 2011 Boundary and Annexation Survey (BAS): St. Francis County, AR (PDF) (Map). U. S. Census Bureau. Archived from the original (PDF) on October 19, 2012. Retrieved August 6, 2011.
- ^ "Arkansas: 2010 Census Block Maps - County Subdivision". United States Census Bureau. Retrieved May 29, 2014.
- ^ "2020 CENSUS - SCHOOL DISTRICT REFERENCE MAP: St. Francis County, AR" (PDF). U.S. Census Bureau. Retrieved May 16, 2023. - Text list
- ^ "SCHOOL DISTRICT REFERENCE MAP (2010 CENSUS): St. Francis County, AR" (PDF). U.S. Census Bureau. Retrieved May 16, 2023. - Text list
Works cited
- Hild, Matthew (2004). "Labor, Third-Party Politics, and New South Democracy in Arkansas, 1884-1896". The Arkansas Historical Quarterly. 63 (1). Arkansas Historical Association: 24–43. doi:10.2307/40019008. JSTOR 40019008.
- Welch, Melanie (2001). "Violence and the Decline of Black Politics in St. Francis County". The Arkansas Historical Quarterly. 60 (4). Arkansas Historical Association: 360–93. doi:10.2307/40038253. JSTOR 40038253.
External links
- St. Francis county official website
- St. Francis, Arkansas entry on the Encyclopedia of Arkansas History & Culture
Places adjacent to St. Francis County, Arkansas | ||||||||||||||||
|---|---|---|---|---|---|---|---|---|---|---|---|---|---|---|---|---|
| ||||||||||||||||
Municipalities and communities of St. Francis County, Arkansas, United States | ||
|---|---|---|
| Cities | 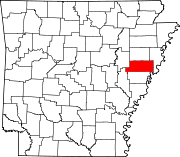 | |
| Towns | ||
| CDP | ||
| Other unincorporated communities | ||
| Footnotes | ‡This populated place also has portions in an adjacent county or counties | |
35°01′36″N 90°42′15″W / 35.02667°N 90.70417°W
| International | |
|---|---|
| National | |
| Other | |