


Otero County is a county located in the U.S. state of Colorado. As of the 2020 census, the population was 18,690.[1] The county seat is La Junta.[2] The county was named for Miguel Antonio Otero, one of the founders of the town of La Junta and a member of a prominent Hispanic family.
Geography
According to the U.S. Census Bureau, the county has a total area of 1,270 square miles (3,300 km2), of which 1,262 square miles (3,270 km2) is land and 7.7 square miles (20 km2) (0.6%) is water.[3]
Adjacent counties
- Crowley County - north
- Kiowa County - northeast
- Bent County - east
- Las Animas County - south
- Pueblo County - west
Major highways
 U.S. Highway 50
 U.S. Highway 350
 State Highway 10
 State Highway 71
 State Highway 109
 State Highway 167
 State Highway 207
 State Highway 266
National protected areas
Trails and byways
Demographics
| Census | Pop. | Note | %± |
|---|---|---|---|
| 1890 | 4,192 | — | |
| 1900 | 11,522 | 174.9% | |
| 1910 | 20,201 | 75.3% | |
| 1920 | 22,623 | 12.0% | |
| 1930 | 24,390 | 7.8% | |
| 1940 | 23,571 | −3.4% | |
| 1950 | 25,275 | 7.2% | |
| 1960 | 24,128 | −4.5% | |
| 1970 | 23,523 | −2.5% | |
| 1980 | 22,567 | −4.1% | |
| 1990 | 20,185 | −10.6% | |
| 2000 | 20,311 | 0.6% | |
| 2010 | 18,831 | −7.3% | |
| 2020 | 18,690 | −0.7% | |
| 2023 (est.) | 18,136 | [4] | −3.0% |
| U.S. Decennial Census[5] 1790-1960[6] 1900-1990[7] 1990-2000[8] 2010-2020[1] | |||
At the 2000 census there were 20,311 people, 7,920 households, and 5,472 families living in the county. The population density was 16 people per square mile (6.2 people/km2). There were 8,813 housing units at an average density of 7 units per square mile (2.7 units/km2). The racial makeup of the county was 79.02% White, 0.76% Black or African American, 1.43% Native American, 0.70% Asian, 0.08% Pacific Islander, 15.06% from other races, and 2.96% from two or more races. 37.62% of the population were Hispanic or Latino of any race.[9] Of the 7,920 households 32.20% had children under the age of 18 living with them, 52.70% were married couples living together, 12.00% had a female householder with no husband present, and 30.90% were non-families. 27.80% of households were one person and 12.90% were one person aged 65 or older. The average household size was 2.49 and the average family size was 3.04.
The age distribution was 26.90% under the age of 18, 8.90% from 18 to 24, 24.40% from 25 to 44, 23.40% from 45 to 64, and 16.50% 65 or older. The median age was 38 years. For every 100 females there were 95.60 males. For every 100 females age 18 and over, there were 91.50 males.
The median household income was $29,738 and the median family income was $35,906. Males had a median income of $26,996 versus $21,001 for females. The per capita income for the county was $15,113. About 14.20% of families and 18.80% of the population were below the poverty line, including 25.90% of those under age 18 and 11.80% of those age 65 or over.
Politics
Otero is a strongly Republican county, although less so than the counties of the Colorado High Plains. It was last won for the Democratic Party by Bill Clinton in 1996. Before that, Otero tended to be a Republican-leaning county at the Presidential level, although it did vote for Wilson twice, FDR in 1932 and 1936, Truman in 1948 and Lyndon Johnson in 1964.
| Year | Republican | Democratic | Third party | |||
|---|---|---|---|---|---|---|
| No. | % | No. | % | No. | % | |
| 2020 | 5,756 | 60.11% | 3,605 | 37.65% | 215 | 2.25% |
| 2016 | 4,928 | 58.31% | 2,943 | 34.82% | 581 | 6.87% |
| 2012 | 4,382 | 53.49% | 3,647 | 44.52% | 163 | 1.99% |
| 2008 | 4,393 | 54.47% | 3,547 | 43.98% | 125 | 1.55% |
| 2004 | 4,947 | 60.48% | 3,164 | 38.68% | 69 | 0.84% |
| 2000 | 4,082 | 55.83% | 2,963 | 40.52% | 267 | 3.65% |
| 1996 | 3,356 | 45.13% | 3,386 | 45.53% | 695 | 9.35% |
| 1992 | 3,120 | 37.53% | 3,485 | 41.92% | 1,708 | 20.55% |
| 1988 | 4,265 | 51.39% | 3,910 | 47.11% | 124 | 1.49% |
| 1984 | 5,373 | 62.37% | 3,005 | 34.88% | 237 | 2.75% |
| 1980 | 4,801 | 54.55% | 3,294 | 37.43% | 706 | 8.02% |
| 1976 | 4,597 | 51.54% | 4,118 | 46.17% | 205 | 2.30% |
| 1972 | 6,016 | 65.75% | 2,929 | 32.01% | 205 | 2.24% |
| 1968 | 4,690 | 49.66% | 3,891 | 41.20% | 864 | 9.15% |
| 1964 | 3,605 | 37.41% | 5,999 | 62.26% | 32 | 0.33% |
| 1960 | 6,015 | 58.80% | 4,199 | 41.05% | 15 | 0.15% |
| 1956 | 5,964 | 61.53% | 3,722 | 38.40% | 7 | 0.07% |
| 1952 | 6,552 | 63.57% | 3,721 | 36.10% | 34 | 0.33% |
| 1948 | 4,311 | 33.08% | 8,640 | 66.30% | 81 | 0.62% |
| 1944 | 5,002 | 56.74% | 3,791 | 43.00% | 23 | 0.26% |
| 1940 | 5,459 | 54.11% | 4,567 | 45.27% | 62 | 0.61% |
| 1936 | 3,859 | 39.49% | 5,775 | 59.10% | 138 | 1.41% |
| 1932 | 3,974 | 42.79% | 5,107 | 54.99% | 206 | 2.22% |
| 1928 | 5,788 | 74.88% | 1,876 | 24.27% | 66 | 0.85% |
| 1924 | 4,694 | 59.19% | 1,938 | 24.44% | 1,298 | 16.37% |
| 1920 | 3,846 | 55.93% | 2,727 | 39.66% | 303 | 4.41% |
| 1916 | 2,678 | 38.68% | 3,963 | 57.24% | 283 | 4.09% |
| 1912 | 1,293 | 20.98% | 2,885 | 46.80% | 1,986 | 32.22% |
| 1908 | 3,232 | 44.47% | 3,542 | 48.73% | 494 | 6.80% |
| 1904 | 2,975 | 53.98% | 2,225 | 40.37% | 311 | 5.64% |
| 1900 | 1,913 | 43.73% | 2,266 | 51.79% | 196 | 4.48% |
| 1896 | 524 | 19.13% | 2,167 | 79.12% | 48 | 1.75% |
| 1892 | 324 | 18.23% | 0 | 0.00% | 1,453 | 81.77% |
Communities
Cities
Towns
Census-designated places
See also
- Bibliography of Colorado
- Geography of Colorado
- History of Colorado
- G.W. Swink, pioneer county commissioner
- National Register of Historic Places listings in Otero County, Colorado
- Index of Colorado-related articles
- List of Colorado-related lists
- Outline of Colorado
References
- ^ a b "State & County QuickFacts". United States Census Bureau. Retrieved September 5, 2021.
- ^ "Find a County". National Association of Counties. Retrieved June 7, 2011.
- ^ "US Gazetteer files: 2010, 2000, and 1990". United States Census Bureau. February 12, 2011. Retrieved April 23, 2011.
- ^ "Annual Estimates of the Resident Population for Counties: April 1, 2020 to July 1, 2023". United States Census Bureau. Retrieved March 31, 2024.
- ^ "U.S. Decennial Census". United States Census Bureau. Retrieved June 10, 2014.
- ^ "Historical Census Browser". University of Virginia Library. Retrieved June 10, 2014.
- ^ "Population of Counties by Decennial Census: 1900 to 1990". United States Census Bureau. Retrieved June 10, 2014.
- ^ "Census 2000 PHC-T-4. Ranking Tables for Counties: 1990 and 2000" (PDF). United States Census Bureau. Archived (PDF) from the original on March 27, 2010. Retrieved June 10, 2014.
- ^ "U.S. Census website". United States Census Bureau. Retrieved May 14, 2011.
- ^ Leip, David. "Dave Leip's Atlas of U.S. Presidential Elections". uselectionatlas.org. Retrieved May 26, 2017.
External links
Places adjacent to Otero County, Colorado | ||||||||||||||||
|---|---|---|---|---|---|---|---|---|---|---|---|---|---|---|---|---|
| ||||||||||||||||
Municipalities and communities of Otero County, Colorado, United States | ||
|---|---|---|
| Cities | 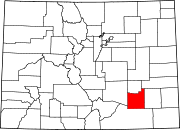 | |
| Towns | ||
| CDPs | ||
| Unincorporated communities | ||
| Ghost town | ||
| Trading posts | ||
37°54′N 103°43′W / 37.90°N 103.71°W
| International | |
|---|---|
| National | |