


Stillwater County is a county in the U.S. state of Montana. As of the 2020 census, the population was 8,963.[1] Its county seat is Columbus.[2]
Geography
According to the United States Census Bureau, the county has a total area of 1,805 square miles (4,670 km2), of which 1,795 square miles (4,650 km2) is land and 9.2 square miles (24 km2) (0.5%) is water.[3]
Major highways
Adjacent counties
- Golden Valley County - north
- Yellowstone County - east
- Carbon County - south
- Park County - southwest
- Sweet Grass County - west
National protected areas
- Custer National Forest (part)
- Grass Lake National Wildlife Refuge
- Hailstone National Wildlife Refuge
Demographics
| Census | Pop. | Note | %± |
|---|---|---|---|
| 1920 | 7,630 | — | |
| 1930 | 6,253 | −18.0% | |
| 1940 | 5,694 | −8.9% | |
| 1950 | 5,416 | −4.9% | |
| 1960 | 5,526 | 2.0% | |
| 1970 | 4,632 | −16.2% | |
| 1980 | 5,598 | 20.9% | |
| 1990 | 6,536 | 16.8% | |
| 2000 | 8,195 | 25.4% | |
| 2010 | 9,117 | 11.3% | |
| 2020 | 8,963 | −1.7% | |
| 2022 (est.) | 9,177 | [4] | 2.4% |
| U.S. Decennial Census[5] 1790–1960,[6] 1900–1990,[7] 1990–2000,[8] 2010–2020[1] | |||
2020 census
As of the 2020 census, there were 8,963 people living in the county.[citation needed]
2010 census
As of the 2010 census, there were 9,117 people, 3,796 households, and 2,657 families in the county. The population density was 5.1 inhabitants per square mile (2.0/km2). There were 4,803 housing units at an average density of 2.7 units per square mile (1.0 units/km2). The racial makeup of the county was 96.8% white, 0.8% American Indian, 0.3% Asian, 0.1% black or African American, 0.4% from other races, and 1.6% from two or more races. Those of Hispanic or Latino origin made up 2.3% of the population. In terms of ancestry, 34.7% were German, 14.1% were Irish, 14.0% were English, 10.8% were Norwegian, and 6.9% were American.
Of the 3,796 households, 28.9% had children under the age of 18 living with them, 60.6% were married couples living together, 6.0% had a female householder with no husband present, 30.0% were non-families, and 25.8% of all households were made up of individuals. The average household size was 2.37 and the average family size was 2.84. The median age was 45.7 years.
The median income for a household in the county was $57,227 and the median income for a family was $65,438. Males had a median income of $51,830 versus $26,909 for females. The per capita income for the county was $27,168. About 6.0% of families and 9.5% of the population were below the poverty line, including 17.9% of those under age 18 and 7.2% of those age 65 or over.
Politics
Stillwater County is a heavily Republican county in presidential elections. It has not voted for a Democratic presidential candidate since Franklin D. Roosevelt in 1936.
| Year | Republican | Democratic | Third party | |||
|---|---|---|---|---|---|---|
| No. | % | No. | % | No. | % | |
| 2020 | 4,462 | 77.95% | 1,156 | 20.20% | 106 | 1.85% |
| 2016 | 3,661 | 75.13% | 908 | 18.63% | 304 | 6.24% |
| 2012 | 3,337 | 70.97% | 1,248 | 26.54% | 117 | 2.49% |
| 2008 | 2,991 | 64.09% | 1,512 | 32.40% | 164 | 3.51% |
| 2004 | 3,090 | 73.34% | 1,025 | 24.33% | 98 | 2.33% |
| 2000 | 2,765 | 70.57% | 925 | 23.61% | 228 | 5.82% |
| 1996 | 1,871 | 49.24% | 1,282 | 33.74% | 647 | 17.03% |
| 1992 | 1,390 | 38.19% | 1,178 | 32.36% | 1,072 | 29.45% |
| 1988 | 1,920 | 56.82% | 1,407 | 41.64% | 52 | 1.54% |
| 1984 | 2,118 | 65.01% | 1,100 | 33.76% | 40 | 1.23% |
| 1980 | 1,828 | 61.26% | 919 | 30.80% | 237 | 7.94% |
| 1976 | 1,446 | 54.88% | 1,143 | 43.38% | 46 | 1.75% |
| 1972 | 1,698 | 67.95% | 716 | 28.65% | 85 | 3.40% |
| 1968 | 1,347 | 61.20% | 676 | 30.71% | 178 | 8.09% |
| 1964 | 1,140 | 50.20% | 1,130 | 49.76% | 1 | 0.04% |
| 1960 | 1,455 | 58.41% | 1,036 | 41.59% | 0 | 0.00% |
| 1956 | 1,540 | 60.32% | 1,013 | 39.68% | 0 | 0.00% |
| 1952 | 1,689 | 67.02% | 816 | 32.38% | 15 | 0.60% |
| 1948 | 1,137 | 54.48% | 890 | 42.64% | 60 | 2.87% |
| 1944 | 1,201 | 56.07% | 934 | 43.60% | 7 | 0.33% |
| 1940 | 1,255 | 50.71% | 1,201 | 48.53% | 19 | 0.77% |
| 1936 | 1,034 | 42.69% | 1,292 | 53.34% | 96 | 3.96% |
| 1932 | 1,085 | 44.23% | 1,281 | 52.22% | 87 | 3.55% |
| 1928 | 1,687 | 70.06% | 711 | 29.53% | 10 | 0.42% |
| 1924 | 1,412 | 59.88% | 375 | 15.90% | 571 | 24.22% |
| 1920 | 1,721 | 70.50% | 664 | 27.20% | 56 | 2.29% |
| 1916 | 918 | 42.01% | 1,197 | 54.78% | 70 | 3.20% |
Communities
Town
- Columbus (county seat)
Census-designated places
Unincorporated communities
Ghost towns
See also
- List of lakes in Stillwater County, Montana
- List of mountains in Stillwater County, Montana
- National Register of Historic Places listings in Stillwater County, Montana
References
- ^ a b "State & County QuickFacts". United States Census Bureau. Retrieved May 8, 2023.
- ^ "Find a County". National Association of Counties. Archived from the original on May 31, 2011. Retrieved June 7, 2011.
- ^ "2010 Census Gazetteer Files". United States Census Bureau. August 22, 2012. Archived from the original on December 5, 2014. Retrieved November 30, 2014.
- ^ "Annual Estimates of the Resident Population for Counties: April 1, 2020 to July 1, 2022". United States Census Bureau. Retrieved May 8, 2023.
- ^ "U.S. Decennial Census". United States Census Bureau. Retrieved November 30, 2014.
- ^ "Historical Census Browser". University of Virginia Library. Retrieved November 30, 2014.
- ^ "Population of Counties by Decennial Census: 1900 to 1990". United States Census Bureau. Retrieved November 30, 2014.
- ^ "Census 2000 PHC-T-4. Ranking Tables for Counties: 1990 and 2000" (PDF). United States Census Bureau. Archived (PDF) from the original on March 27, 2010. Retrieved November 30, 2014.
- ^ Leip, David. "Atlas of US Presidential Elections". uselectionatlas.org. Retrieved April 3, 2018.
- ^ Meyers Creek MT Google Maps (accessed January 7, 2019)
- ^ Reed Point MT Google Maps (accessed January 7, 2019)
Further reading
- Hooker, Patty; Museum of the Beartooths (2011). Columbus and Stillwater County. Images of America. Charleston SC: Arcadia Pub. ISBN 9780738574622.
- Hooker, Patty (2013). Moccasins, Mining & Montana's 34th county: A Centennial Celebration of Stillwater County. Virginia Beach VA: Donning Co. ISBN 9781578648122.
Places adjacent to Stillwater County, Montana | ||||||||||||||||
|---|---|---|---|---|---|---|---|---|---|---|---|---|---|---|---|---|
| ||||||||||||||||
Municipalities and communities of Stillwater County, Montana, United States | ||
|---|---|---|
| Town | 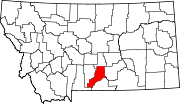 | |
| CDPs | ||
| Other communities | ||
| Ghost towns | ||
| International | |
|---|---|
| National | |
| Geographic | |
| Other | |