

| Part of a series on |
| World trade |
|---|
 |


Foreign trade of the United States comprises the international imports and exports of the United States. The country is among the top three global importers and exporters.


The regulation of trade is constitutionally vested in the United States Congress. After the Great Depression, the country emerged as among the most significant global trade policy-makers, and it is now a partner to a number of international trade agreements, including the General Agreement on Tariffs and Trade (GATT) and the World Trade Organization (WTO). Gross U.S. assets held by foreigners were $16.3 trillion as of the end of 2006 (over 100% of GDP).
Introduction
The country has trade relations with many other countries. Within that, the trade with Europe and Asia is predominant. To fulfill the demands of the industrial sector, the country has to import mineral oil and iron ore on a large scale. Machinery, cotton yarn, toys, mineral oil, lubricants, steel, tea, sugar, coffee, and many more items are traded. The country's export list includes food grains like wheat, corn, and soybeans, as well as aeroplanes, cars, computers, paper, and machine tools required for different industries. In 2016 United States current account balance was negative $469,400,000,000.[2] US manufacturers exported $1,365.31 billion in goods exports in 2019, with Canada, Mexico, China, Japan and the United Kingdom representing 35.44% of the export market.[3]
Relatively few US companies export; a 2009 study reported that 18% of US manufacturers export their goods. Exporting is concentrated to a small number of companies: the largest 1% of US companies that export comprise 81% of US exports.[4]
History
The authority of Congress to regulate international trade is set out in the United States Constitution (Article I, Section 8, Paragraph 1):
The Congress shall have power To lay and collect Taxes, Duties, Imposts and Excises, to pay the Debts and provide for the common Defence and to promote the general Welfare of the United States; but all Duties, Imposts and Excises shall be uniform throughout the United States
Congressional authority over international trade includes the power to impose tariffs and to establish tariff rates; implementing trade agreements; providing remedies against unfairly traded imports; controlling the export of sensitive technology and extending tariff preferences to imports from developing countries. Over time, and under carefully prescribed circumstances, Congress has delegated some of its trade authority to the Executive Branch. Congress, however, has, in some cases, kept tight reins on the use of this authority by requiring that certain trade laws and programs be renewed; and by requiring the Executive Branch to issue reports to Congress so the latter can monitor the implementation of the trade laws and programs.[5] The Embargo Act of 1807 was designed to force Britain to rescind its restrictions on American trade, but failed, and was repealed in early 1809.
During the Civil War, leaders of the Confederacy were confident that Britain would come to their aid because of British reliance on Southern cotton.[6] The Union was able to avoid this, through skillful use of diplomacy and threats to other aspects of European-U.S. trade relations.
Near the end of the Second World War U.S. policy makers began to experiment on a broader level. In the 1940s, working with the British government, the United States developed two innovations to expand and govern trade among nations: the General Agreement on Tariffs and Trade (GATT) and the International Trade Organization (ITO). GATT was a temporary multilateral agreement designed to provide a framework of rules and a forum to negotiate trade barrier reductions among nations.
The growing importance of international trade led to the establishment of the Office of the U.S. Trade Representative in 1963 by Executive Order 11075, originally called The Office of the Special Representative for Trade Negotiations.[7]
Trade policy

United States trade policy has varied widely through various American historical and industrial periods. As a major developed nation, the U.S. has relied heavily on the import of raw materials and the export of finished goods. Because of the significance for American economy and industry, much weight has been placed on trade policy by elected officials and business leaders.[8][9]
International trade also influences the U.S. presidential election since voters' exposure to trade influences who wins the US presidency, according to US Census data covering nearly all economic activity in the United States. Moreover, employees in high-wage tradable goods and services sectors are more likely to support incumbent presidents and their parties, whereas those in low-wage manufacturing jobs will be more likely to support the opposition.[10]
The 1920s marked a decade of economic growth in the United States following a Classical supply side policy.[11] U.S. President Warren Harding signed the Emergency Tariff of 1921 and the Fordney–McCumber Tariff of 1922. Harding's policies reduced taxes and protected U.S. business and agriculture.[12] Following the Great Depression and World War II, the United Nations Monetary and Financial Conference brought the Bretton Woods currency agreement followed by the economy of the 1950s and 1960s. In 1971, President Richard Nixon ended U.S. ties to Bretton Woods, leaving the U.S. with a floating fiat currency. The stagflation of the 1970s saw a U.S. economy characterized by slower GDP growth. In 1988, the United States ranked first in the world in the Economist Intelligence Unit "quality of life index" and third in the Economic Freedom of the World Index.[13]
Over the long run, nations with trade surpluses tend also to have a savings surplus. The U.S. generally has developed lower savings rates than its trading partners, which have tended to have trade surpluses. Germany, France, Japan, and Canada have maintained higher savings rates than the U.S. over the long run.[14]
Some economists believe that GDP and employment can be dragged down by an over-large deficit over the long run.[15] Others believe that trade deficits are good for the economy.[16] The opportunity cost of a forgone tax base may outweigh perceived gains, especially where artificial currency pegs and manipulations are present to distort trade.[17]
In 2006, the primary economic concerns focused on: high national debt ($9 trillion), high non-bank corporate debt ($9 trillion), high mortgage debt ($9 trillion), high financial institution debt ($12 trillion), high unfunded Medicare liability ($30 trillion), high unfunded Social Security liability ($12 trillion), high external debt (amount owed to foreign lenders) and a serious deterioration in the United States net international investment position (NIIP) (−24% of GDP),[1] high trade deficits, and a rise in illegal immigration.[18][19]
These issues have raised concerns among economists and unfunded liabilities were mentioned as a serious problem facing the United States in the President's 2006 State of the Union address.[19][20] On June 26, 2009, Jeff Immelt, the CEO of General Electric, called for the U.S. to increase its manufacturing base employment to 20% of the workforce, commenting that the U.S. has outsourced too much in some areas and can no longer rely on the financial sector and consumer spending to drive demand.[21]
In 1985, the U.S. had just begun a growing trade deficit with China. During the 1990s, the U.S. trade deficit became a more excessive long-run trade deficit, mostly with Asia. By 2012, the U.S. trade deficit, fiscal budget deficit, and federal debt increased to record or near-record levels following the implementation of broad unconditional or unilateral U.S. free trade policies and formal trade agreements in the preceding decades.[22][23]
The US last had a trade surplus in 1975.[24] However, recessions may cause short-run anomalies to rising trade deficits.[clarify]
The balance of trade in the United States has been a concern among economists and business people. Warren Buffett, founder of Berkshire Hathaway, was quoted in the Associated Press (January 20, 2006) as saying "The U.S. trade deficit is a bigger threat to the domestic economy than either the federal budget deficit or consumer debt and could lead to political turmoil... Right now, the rest of the world owns $3 trillion more of us than we own of them."
In both a 1987 guest editorial to the Omaha-World Herald and a more detailed 2003 Fortune article, Buffett proposed a tool called Import Certificates as a solution to the United States' problem and ensure balanced trade. "The rest of the world owns a staggering $2.5 trillion more of the U.S. than we own of other countries. Some of this $2.5 trillion is invested in claim checks—U.S. bonds, both governmental and private—and some in such assets as property and equity securities."[25]
In 2013 the United States' largest trading partner was Canada.[26] China has seen substantial economic growth in the past 50 years[when?] and though a nuclear-security summit that took place in early 2010 President Obama hoped to ensure another 50 years of growth between the two countries. On April 19, 2010, President Obama met with China's paramount leader Hu Jintao to discuss trade policies between the two countries.[citation needed]
Though the US trade deficit has been stubborn, and tends to be the largest by dollar volume of any nation, even the most extreme months as measured by percent of GDP there are nations that are far more noteworthy. Case in point, post 2015 Nepal earthquake, Nepal's trade gap (in goods & services) was a shocking 33.3% of GDP[27] although heavy remittances considerably offset that number. According to the US Department of Commerce Bureau of Economic Analysis (BEA), January 27, 2017 report, the GDP "increased 4.0 percent, or $185.5 billion, in the fourth quarter of 2016 to a level of $18,860.8 billion."[28]
In 2018, the year that a trade war with China was launched by U.S. President Donald Trump, the U.S. trade deficit in goods reached $891 billion, which was the largest on record[29] before the $1,183 billion deficit in the trade of goods recorded in 2021.[30] By the end of the Trump presidency, the trade war was widely characterized as a failure.[31]
Customs territory
The main customs territory of the United States includes the 50 states, the District of Columbia, and the territory of Puerto Rico, with the exception of over 200 foreign trade zones designated to encourage economic activity. People and goods entering this territory are subject to inspection by U.S. Customs and Border Protection. The remaining insular areas are separate customs territories administered largely by local authorities:
- American Samoa
- Guam
- Northern Mariana Islands
- United States Minor Outlying Islands (mostly uninhabited)
- United States Virgin Islands
Transportation of certain living things or agricultural products may be prohibited even within a customs territory. This is enforced by U.S. Customs and Border Protection, the federal Animal and Plant Health Inspection Service, and even state authorities such as the California Department of Food and Agriculture.
Items shipped to U.S. territories are not considered exports and are exempt from tariffs, but items shipped to Guam pay a 4% sales or use tax, items shipped to the USVI pay an excise tax (typically 0% to 4%), and Puerto Rico charges a consumption tax of 10.5–11.5%.[32]
ITAR regulations apply only when shipping to outside the United States and its territories, whether from inside or outside the main customs zone.[33]
Shipments from US territories other than Puerto Rico into the main customs territory are considered imports, and are subject to import tariffs,[34] with exceptions on certain goods listed in the Code of Federal Regulations.[35]
Investment in the United States
Gross U.S. assets held by foreigners were $16.3 trillion as of the end of 2006 (over 100% of GDP). The U.S. net international investment position (NIIP)[36] became a negative $2.5 trillion at the end of 2006, or about minus 19% of GDP.[1][37]
This figure rises as long as the U.S. maintains an imbalance in trade, when the value of imports substantially outweighs the value of exports. This external debt does not result mostly from loans to Americans or the American government, nor is it consumer debt owed to non-U.S. creditors. It is an accounting entry that largely represents U.S. domestic assets purchased with trade dollars and owned overseas, largely by U.S. trading partners.[38]
For countries like the United States, a large net external debt is created when the value of foreign assets (debt and equity) held by domestic residents is less than the value of domestic assets held by foreigners. In simple terms, as foreigners buy property in the U.S., this adds to the external debt. When this occurs in greater amounts than Americans buying property overseas, nations like the United States are said to be debtor nations, but this is not conventional debt like a loan obtained from a bank.[1][36]

If the external debt represents foreign ownership of domestic assets, the result is that rental income, stock dividends, capital gains and other investment income is received by foreign investors, rather than by U.S. residents. On the other hand, when American debt is held by overseas investors, they receive interest and principal repayments. As the trade imbalance puts extra dollars in hands outside of the U.S., these dollars may be used to invest in new assets (foreign direct investment, such as new plants) or be used to buy existing American assets such as stocks, real estate and bonds. With a mounting trade deficit, the income from these assets increasingly transfers overseas.[1][36]
Of major concern is the magnitude of the NIIP (or net external debt), which is larger than those of most national economies. Fueled by the sizable trade deficit, the external debt is so large that economists are concerned over whether the current account deficit is unsustainable. A complicating factor is that trading partners such as China, depend for much of their economy on exports, especially to America. There are many controversies about the current trade and external debt situation, and it is arguable whether anyone understands how these dynamics will play out in a historically unprecedented floating exchange rate system. While various aspects of the U.S. economic profile have precedents in the situations of other countries (notably government debt as a percentage of GDP), the sheer size of the U.S., and the integral role of the U.S. economy in the overall global economic environment, create considerable uncertainty about the future.[1][36]
According to economists such as Larry Summers and Paul Krugman, the enormous inflow of capital from China is one of the causes of the global financial crisis of 2008–2009. China had been buying huge quantities of dollar assets to keep its currency value low and its export economy humming, which caused American interest rates and saving rates to remain artificially low. These low interest rates, in turn, contributed to the United States housing bubble because when mortgages are cheap, house prices are inflated as people can afford to borrow more.[40][41]
Trade agreements

The United States is a partner to many trade agreements, shown in the chart below and the map to the right.
The United States has also negotiated many Trade and Investment Framework Agreements, which are often precursors to free trade agreements. It has also negotiated many bilateral investment treaties, which concern the movement of capital rather than goods.
The U.S. is a member of several international trade organizations. The purpose of joining these organizations is to come to agreement with other nations on trade issues, although there is domestic political controversy to whether or not the U.S. government should be making these trade agreements in the first place. These organizations include:
- World Trade Organization
- Organization of American States
- Security and Prosperity Partnership of North America
| Existing |
| ||||||
|---|---|---|---|---|---|---|---|
| Proposed |
| ||||||
Defunct or expired |
| ||||||
As of 26 February 2022, The United States has barred most Russian imports including (semiconductors, lasers, liquor, computers) etc. due to the 2022 Russian-Ukraine War. This is the biggest bar on imports in the U.S. since WWll. The U.S. and Canada partnered on the ban of liquor and food stuff on 25, February 2022 after it was announced that Russian troops had taken Chernobyl nuclear power plant.
Internal institutions
American foreign trade is regulated internally by:
Imports and exports
-
 Proportion of US exports to imports 1960–2004
 -
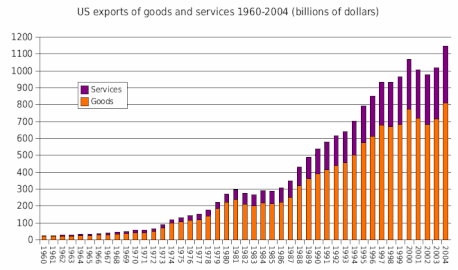 US exports of goods and services 1960–2004
 -
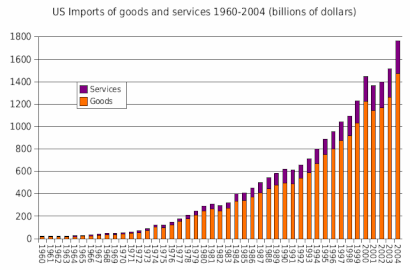 US imports of goods and services 1960–2004


-
 US exports of goods by country in 2004 (does not include exports of services)
 -
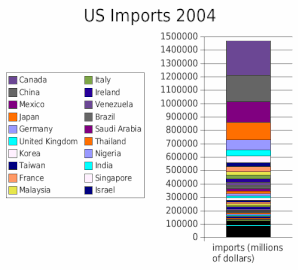 US imports of goods by country in 2004 (does not include imports of services)


See also
References
- ^ a b c d e f Bivens, L. Josh (December 14, 2004). Debt and the dollar Archived December 17, 2004, at the Wayback Machine Economic Policy Institute. Retrieved on July 8, 2007.
- ^ "The World Factbook – Central Intelligence Agency". Cia.gov. Archived from the original on 2 June 2010. Retrieved 4 October 2017.
- ^ "2020 United States Manufacturing Facts". NAM. Archived from the original on 2022-03-03. Retrieved 2022-03-03.
- ^ Kim, In Song; Osgood, Iain (2019-05-11). "Firms in Trade and Trade Politics". Annual Review of Political Science. 22 (1): 399–417. doi:10.1146/annurev-polisci-050317-063728. ISSN 1094-2939.
- ^ Bolle, Mary Jane (2007-10-02). "U.S. Trade Statutes: Expiration Dates and Mandated Periodic Reports to Congress" (PDF). Archived (PDF) from the original on 2011-07-19. Retrieved 2008-07-24.This article incorporates text from this source, which is in the public domain.
- ^ U.S. Department of State, Office of the Historian Archived 2020-07-31 at the Wayback Machine Preventing Diplomatic Recognition of the Confederacy
- ^ International Trade and Investment art S. Fisher and Michael P. Malloy
- ^ "World Business Leaders Urge Trade Ministers To Seize The Opportunity to Resurrect the Doha Round – Trade Resource Center – Business Roundtable". 3 January 2006. Archived from the original on 3 January 2006. Retrieved 15 March 2018.
- ^ Akhtar, Shayerah Ilias (November 1, 2018). U.S. Trade Policy Functions: Who Does What? (PDF). Washington, DC: Congressional Research Service. Archived (PDF) from the original on 16 August 2021. Retrieved 11 November 2018.
- ^ Jensen, J. Bradford; Quinn, Dennis; Weymouth, Stephen (January 2016), Winners and Losers in International Trade: The Effects on U.S. Presidential Voting, pp. w21899, doi:10.3386/w21899
- ^ Joseph A. Schumpeter, "The Decade of the Twenties", American Economic Review vol. 36, No. 2, (May, 1946), pp. 1–10 in JSTOR Archived 2017-03-27 at the Wayback Machine
- ^ "The Harding/Coolidge Prosperity of the 1920s". Calvin-coolidge.org. Archived from the original on 2009-03-12. Retrieved 2009-03-30.
- ^ Star Parker (December 17, 2012).Tea Partiers must hang tough Archived 2013-02-05 at the Wayback Machine.Urbancure.com
- ^ "The shift away from thrift". The Economist, April 7, 2005.
- ^ "Causes and Consequences of the Trade Deficit: An Overview". www.cbo.gov. Archived from the original on March 15, 2008.
- ^ "Growing Trade Deficit Good News for U.S. Economy". Blog.heritage.org. 12 January 2010. Archived from the original on 9 August 2011. Retrieved 4 October 2017.
- ^ Bivens, Josh (September 25, 2006 ).China Manipulates Its Currency – A Response is Needed Archived 2011-08-12 at the Wayback Machine. Economic Policy Institute. Retrieved on February 2, 2010.
- ^ Phillips, Kevin (2007). Bad Money: Reckless Finance, Failed Politics, and the Global Crisis of American Capitalism. Penguin. ISBN 978-0-14-314328-4.
- ^ a b Cauchon, Dennis and John Waggoner (October 3, 2004). The Looming National Benefit Crisis Archived 2012-09-29 at the Wayback Machine USA Today
- ^ George W. Bush (2006) State of the Union. Retrieved on April 17, 2009. Archived November 23, 2009, at the Wayback Machine
- ^ Bailey, David and Soyoung Kim (June 26, 2009).GE's Immelt says U.S. economy needs industrial renewal. UK Guardian.. Retrieved on June 28, 2009. Archived August 15, 2009, at the Wayback Machine
- ^ "U.S. Trade in Goods and Services – Balance of Payments, 1960 through 2014". Census.gov. Archived from the original on July 24, 2017. Retrieved October 4, 2017.
- ^ "FTD – Statistics – Country Data – U.S. Trade Balance with World (Seasonally Adjusted)". Census.gov. Archived from the original on September 1, 2022. Retrieved October 4, 2017.
- ^ "Table 1288. U.S. Exports, General Imports, and Trade Balance in Goods: 1970 to 2004". Archived from the original on 2013-05-17. Retrieved 2013-02-04.
- ^ America's Growing Trade Deficit Archived 2014-04-09 at the Wayback Machine Warren E. Buffett
- ^ Division, US Census Bureau Foreign Trade. "Foreign Trade: Data". Census.gov. Archived from the original on September 24, 2017. Retrieved October 4, 2017.
- ^ "Nepal's trade deficit soars to 33.34 percent of GDP". Kathmandupost.ekantipur.com. Archived from the original on 2017-10-04. Retrieved 4 October 2017.
- ^ Bureau of Economic Analysis (BEA) (January 27, 2017), "National Income and Product Accounts : Gross Domestic Product: Fourth Quarter and Annual 2016 (Advance Estimate)", US Department of Commerce, archived from the original on August 14, 2018, retrieved February 24, 2017
- ^ Politti, James; Rocco, Matthew (March 6, 2019). "Blow to Trump as US trade deficit hits 10-year high". Financial Times. Archived from the original on March 10, 2019. Retrieved March 8, 2019.
- ^ "List of markets for the selected product. Product: TOTAL All products". TRADE MAP.
- ^ Multiple sources:
- "New data show the failures of Donald Trump's China trade strategy". The Economist. February 10, 2021. Archived from the original on May 13, 2021. Retrieved September 8, 2022.
- "How China Won Trump's Trade War and Got Americans to Foot the Bill". Bloomberg News. January 11, 2021. Archived from the original on 2021-06-15. Retrieved 2022-09-08.
- Hass, Ryan (August 7, 2020). "More pain than gain: How the US-China trade war hurt America". Brookings Institution. Archived from the original on August 15, 2020. Retrieved September 8, 2022.
- Zumbrun, Josh; Davis, Bob (October 25, 2020). "China Trade War Didn't Boost U.S. Manufacturing Might". The Wall Street Journal. Archived from the original on January 9, 2021. Retrieved September 8, 2022.
- Lester, Simon (January 25, 2021). "Why Did Donald Trump's Trade War on China Fail?". Cato Institute. Archived from the original on June 10, 2021. Retrieved September 8, 2022.
- Disis, Jill (25 October 2020). "Analysis: Trump promised to win the trade war with China. He failed". CNN. Archived from the original on 25 October 2020. Retrieved 8 September 2022.
- Elegant, Naomi (February 8, 2021). "The centerpiece of Trump's trade deal with China 'failed spectacularly'". Fortune. Archived from the original on May 8, 2021. Retrieved September 8, 2022.
- White, Martha (January 20, 2021). "Trump's economic legacy: Trade wars, tariffs and tax breaks". NBC News. Archived from the original on April 5, 2021. Retrieved September 8, 2022.
- Boehm, Eric (January 19, 2021). "Trump Promised a 'Good and Easy To Win' Trade War, Then Lost It". Reason. Archived from the original on June 17, 2021. Retrieved September 8, 2022.
- Gramm, Phil (March 2, 2021). "Trump's Protectionist Failure". The Wall Street Journal. Archived from the original on June 13, 2021. Retrieved September 8, 2022.
- ^ "Import Tariffs Overview and Resources". International Trade Administration. 13 April 2022. Archived from the original on 3 February 2024. Retrieved 3 February 2024.
- ^ "9 – Shipping to Puerto Rico and other U.S. Territories". International Trade Administration. February 20, 2018. Archived from the original on February 3, 2024. Retrieved February 3, 2024.
- ^ Josh Kimble (January 28, 2022). "Taxes on Imported Goods: A Guide to Tariffs, Duties, and More". AFC International. Archived from the original on February 3, 2024. Retrieved February 3, 2024.
- ^ 19 CFR 7.3
- ^ a b c d Chapter 5–10: The International Investment Position. International Finance Theory and Policy. 3 June 2004. Archived from the original on 24 December 2006. Retrieved 17 November 2008.
- ^ "News Release: U.S. International Investment Position, 2006". BEA. June 28, 2007. Archived from the original on 2008-10-13. Retrieved 2008-11-17.
- ^ Bivens, L. Josh (December 14, 2004). "Debt and the dollar: The United States damages future living standards by borrowing itself into a deceptively deep hole". Epinet.org. Archived from the original on January 20, 2008. Retrieved 2009-06-28.
- ^ Current account balance, U.S. dollars, Billions Archived 2011-06-04 at the Wayback Machine from International Monetary Fund World Economic Outlook Database, April 2008
- ^ "Reflections on Global Account Imbalances and Emerging Markets Reserve Accumulation". 9 May 2008. Archived from the original on 9 May 2008. Retrieved 4 October 2017.
- ^ "The Unofficial Paul Krugman Web Page". Pkarchive.org. Retrieved 4 October 2017.