


Size of this preview: 599 × 600 pixels. Other resolutions: 240 × 240 pixels | 479 × 480 pixels | 767 × 768 pixels | 1,022 × 1,024 pixels | 2,400 × 2,404 pixels.
Original file (2,400 × 2,404 pixels, file size: 2.56 MB, MIME type: image/png)
Summary
| Description |
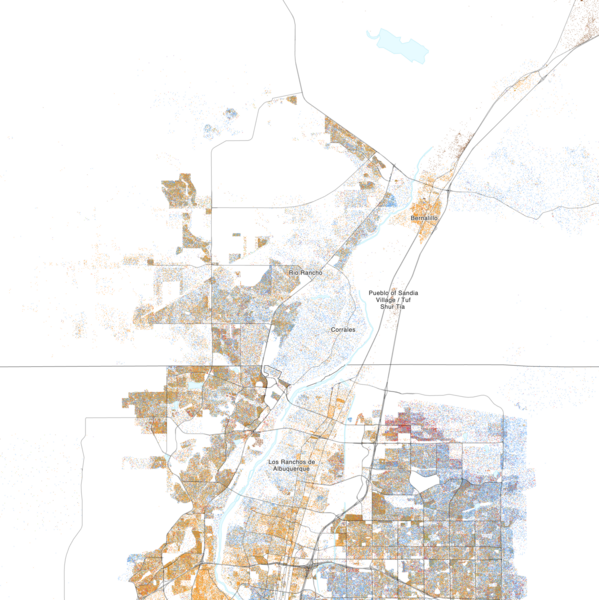
English: Map of the distribution of races and ethnicities in US cities, inspired by similar maps created by Dustin Cable and others.
Blue is White, Green is Black, Red is Asian, Orange is Hispanic, Purple is Multiracial, and Brown is Native American/Other. Each dot represents one person. Data from Census 2020. Base map © OpenStreetMap, CC-BY-SA |
| Date | |
| Source | https://www.censusdots.com/ |
| Author | CensusDots |
| Camera location | | View this and other nearby images on: OpenStreetMap |
|---|
Licensing
This file is licensed under the Creative Commons Attribution-Share Alike 4.0 International license.
- You are free:
- to share – to copy, distribute and transmit the work
- to remix – to adapt the work
- Under the following conditions:
- attribution – You must give appropriate credit, provide a link to the license, and indicate if changes were made. You may do so in any reasonable manner, but not in any way that suggests the licensor endorses you or your use.
- share alike – If you remix, transform, or build upon the material, you must distribute your contributions under the same or compatible license as the original.
File history
Click on a date/time to view the file as it appeared at that time.
| Date/Time | Thumbnail | Dimensions | User | Comment | |
|---|---|---|---|---|---|
| current | 02:22, 4 March 2024 | | 2,400 × 2,404 (2.56 MB) | GeneralGreen | =={{int:filedesc}}== {{Information |description={{en|1=Map of the distribution of races and ethnicities in US cities, inspired by similar maps created by Dustin Cable and others. Blue is White, Green is Black, Red is Asian, Orange is Hispanic, Purple is Multiracial, and Brown is Native American/Other. Each dot represents one person. Data from Census 2020. Base map © OpenStreetMap, CC-BY-SA}} |date=2024-03-03 |source=https://www.censusdots.com/ |author=CensusDots |permiss... |
File usage
The following pages on the English Wikipedia use this file (pages on other projects are not listed):