

Wild Horse Reservoir is a man-made lake in Elko County, Nevada in the United States. The reservoir was initially created in 1937 by the construction of Wild Horse Dam. In 1969, a new concrete single-angle arch dam was constructed by the United States Bureau of Reclamation for the Bureau of Indian Affairs with a height of 87 feet (27 m) and a length of 458 feet (140 m) at its crest. The original 1937 dam was left in place and is still partly visible. The newer dam doubled the size of the reservoir.[3]
The reservoir impounds the Owyhee River for flood control and irrigation storage, part of the larger Duck Valley Irrigation Project. The dam and reservoir are owned and administered by the BIA, and leased to the nearby Duck Valley Indian Reservation (Sho-Pai). Recreation on the lake includes fishing for trout, bass, catfish and perch. The state of Nevada also maintains the adjacent Wild Horse State Recreation Area.[4]
The small community of Wild Horse is located on the south shore.[5]
Gallery
-
 Double dams of Wild Horse Reservoir
 -
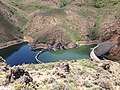
 Wild Horse Reservoir viewed from rock outcrop above dam
 -
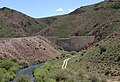 Wild Horse Dam viewed from downstream
 -
 Sign describing Wild Horse Dam


Climate
Wild Horse Reservoir has a humid continental climate (Dfb) bordering on a subalpine climate (Dfc). Summers are warm to hot with brisk nights, and tend to be drier than other times of the year. Winters are very chilly with heavy snowfall and nights near zero.
| Climate data for Wild Horse Reservoir, Nevada, 1991–2020 normals, extremes 1982–present | |||||||||||||
|---|---|---|---|---|---|---|---|---|---|---|---|---|---|
| Month | Jan | Feb | Mar | Apr | May | Jun | Jul | Aug | Sep | Oct | Nov | Dec | Year |
| Record high °F (°C) | 58 (14) |
61 (16) |
70 (21) |
80 (27) |
89 (32) |
96 (36) |
102 (39) |
98 (37) |
98 (37) |
86 (30) |
71 (22) |
60 (16) |
102 (39) |
| Mean maximum °F (°C) | 44.7 (7.1) |
47.2 (8.4) |
58.1 (14.5) |
69.5 (20.8) |
77.9 (25.5) |
87.2 (30.7) |
94.1 (34.5) |
92.2 (33.4) |
87.5 (30.8) |
75.8 (24.3) |
61.9 (16.6) |
47.7 (8.7) |
95.0 (35.0) |
| Mean daily maximum °F (°C) | 32.7 (0.4) |
36.0 (2.2) |
44.3 (6.8) |
52.0 (11.1) |
62.2 (16.8) |
73.2 (22.9) |
84.6 (29.2) |
83.4 (28.6) |
73.6 (23.1) |
59.5 (15.3) |
44.6 (7.0) |
34.0 (1.1) |
56.7 (13.7) |
| Daily mean °F (°C) | 18.8 (−7.3) |
21.8 (−5.7) |
30.7 (−0.7) |
38.3 (3.5) |
46.3 (7.9) |
54.4 (12.4) |
62.8 (17.1) |
61.2 (16.2) |
52.2 (11.2) |
41.4 (5.2) |
30.3 (−0.9) |
20.3 (−6.5) |
39.9 (4.4) |
| Mean daily minimum °F (°C) | 4.9 (−15.1) |
7.6 (−13.6) |
17.0 (−8.3) |
24.6 (−4.1) |
30.4 (−0.9) |
35.6 (2.0) |
40.9 (4.9) |
39.0 (3.9) |
30.8 (−0.7) |
23.3 (−4.8) |
16.0 (−8.9) |
6.6 (−14.1) |
23.1 (−5.0) |
| Mean minimum °F (°C) | −21.1 (−29.5) |
−18.4 (−28.0) |
−5.3 (−20.7) |
8.7 (−12.9) |
16.6 (−8.6) |
23.6 (−4.7) |
28.8 (−1.8) |
26.6 (−3.0) |
16.7 (−8.5) |
6.8 (−14.0) |
−8.4 (−22.4) |
−19.3 (−28.5) |
−27.5 (−33.1) |
| Record low °F (°C) | −36 (−38) |
−42 (−41) |
−30 (−34) |
−7 (−22) |
7 (−14) |
16 (−9) |
17 (−8) |
11 (−12) |
5 (−15) |
−10 (−23) |
−32 (−36) |
−42 (−41) |
−42 (−41) |
| Average precipitation inches (mm) | 1.69 (43) |
1.00 (25) |
1.20 (30) |
1.42 (36) |
1.60 (41) |
0.78 (20) |
0.52 (13) |
0.42 (11) |
0.56 (14) |
0.83 (21) |
1.13 (29) |
1.69 (43) |
12.84 (326) |
| Average snowfall inches (cm) | 27.8 (71) |
16.7 (42) |
14.9 (38) |
12.9 (33) |
3.9 (9.9) |
0.4 (1.0) |
0.0 (0.0) |
0.0 (0.0) |
0.3 (0.76) |
2.2 (5.6) |
14.3 (36) |
23.6 (60) |
117.0 (297) |
| Average extreme snow depth inches (cm) | 25.4 (65) |
25.8 (66) |
18.2 (46) |
5.6 (14) |
0.8 (2.0) |
0.0 (0.0) |
0.0 (0.0) |
0.0 (0.0) |
0.0 (0.0) |
0.6 (1.5) |
7.3 (19) |
16.1 (41) |
28.9 (73) |
| Average precipitation days (≥ 0.01 in) | 11.9 | 9.7 | 10.2 | 11.0 | 10.4 | 6.0 | 4.2 | 3.6 | 4.5 | 5.6 | 8.5 | 10.8 | 96.4 |
| Average snowy days (≥ 0.1 in) | 9.7 | 7.5 | 6.7 | 5.4 | 1.7 | 0.1 | 0.0 | 0.0 | 0.3 | 1.2 | 5.5 | 8.9 | 47.0 |
| Source 1: NOAA[6] | |||||||||||||
| Source 2: National Weather Service[7] | |||||||||||||
See also
References
- ^ "Wild Horse Reservoir". Geographic Names Information System. United States Geological Survey, United States Department of the Interior. Retrieved Jan 17, 2021.
- ^ United States Geological Survey (2013). "Wild Horse Reservoir" (PDF). Retrieved 2015-01-11.
- ^ "Nevada Department of Wildlife".
- ^ "Wild Horse State Recreation Area | State Parks".
- ^ "Wild Horse, Nevada". Geographic Names Information System. United States Geological Survey, United States Department of the Interior.
- ^ "U.S. Climate Normals Quick Access – Station: Wild Horse RSVR, NV". National Oceanic and Atmospheric Administration. Retrieved January 25, 2023.
- ^ "NOAA Online Weather Data – NWS Elko". National Weather Service. Retrieved January 25, 2023.