

Office for National Statistics (2017-19, 2020-22)
By default the table is sorted by arithmetic mean for 2017-2019.
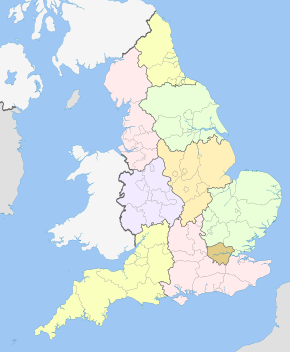
Regions of England
| constituent country or region of England |
2017-2019 | change | 2020-2022 | ||||||
|---|---|---|---|---|---|---|---|---|---|
| male | female | sex gap | arith. mean | male | female | sex gap | arith. mean | ||
| London region | 80.9 | 84.7 | 3.8 | 82.80 | −1.4 | 79.13 | 83.64 | 4.51 | 81.39 |
| South East England | 80.8 | 84.3 | 3.5 | 82.55 | −0.6 | 80.12 | 83.84 | 3.72 | 81.98 |
| South West England | 80.4 | 84.1 | 3.7 | 82.25 | −0.3 | 80.04 | 83.94 | 3.90 | 81.99 |
| East of England | 80.5 | 83.9 | 3.4 | 82.20 | −0.6 | 79.80 | 83.50 | 3.70 | 81.65 |
| England on average | 79.8 | 83.4 | 3.6 | 81.60 | −0.8 | 78.85 | 82.82 | 3.97 | 80.83 |
| East Midlands | 79.5 | 82.9 | 3.4 | 81.20 | −0.7 | 78.59 | 82.44 | 3.85 | 80.52 |
| West Midlands | 79.0 | 82.9 | 3.9 | 80.95 | −0.8 | 78.05 | 82.20 | 4.15 | 80.12 |
| Northern Ireland | 78.8 | 82.6 | 3.8 | 80.70 | −0.4 | 78.42 | 82.25 | 3.83 | 80.33 |
| Yorkshire and the Humber | 78.8 | 82.5 | 3.7 | 80.65 | −0.8 | 77.88 | 81.85 | 3.97 | 79.86 |
| Wales | 78.5 | 82.3 | 3.8 | 80.40 | −0.6 | 77.91 | 81.77 | 3.86 | 79.84 |
| North West England | 78.4 | 82.1 | 3.7 | 80.25 | −0.9 | 77.28 | 81.34 | 4.06 | 79.31 |
| North East England | 78.0 | 81.8 | 3.8 | 79.90 | −0.7 | 77.16 | 81.18 | 4.02 | 79.17 |
| Scotland | 77.2 | 81.1 | 3.9 | 79.15 | −0.5 | 76.52 | 80.73 | 4.21 | 78.62 |
Data source: Office for National Statistics.[1][2] Data for Scotland for 2022-22 are taken from adjacent table of the same agency.[3]
Eurostat (2017, 2018)
By default the table is sorted by 2018.
| code | region | 2017 | 2017 →2018 |
2018 | ||||||
|---|---|---|---|---|---|---|---|---|---|---|
| overall | male | female | F Δ M | overall | male | female | F Δ M | |||
| UKI3 | Inner London - West | 83.9 | 82.2 | 85.6 | 3.4 | 0.8 | 84.7 | 82.9 | 86.5 | 3.6 |
| UKI7 | Outer London - West and North West | 83.7 | 82.0 | 85.4 | 3.4 | −0.3 | 83.4 | 81.4 | 85.3 | 3.9 |
| UKJ1 | Berkshire, Buckinghamshire, and Oxfordshire | 82.9 | 81.1 | 84.6 | 3.5 | 0.3 | 83.2 | 81.6 | 84.7 | 3.1 |
| UKJ2 | Surrey, East and West Sussex | 82.8 | 81.1 | 84.5 | 3.4 | 0.1 | 82.9 | 81.2 | 84.6 | 3.4 |
| UKI6 | Outer London - South | 83.1 | 81.3 | 84.8 | 3.5 | −0.4 | 82.7 | 80.9 | 84.4 | 3.5 |
| UKJ3 | Hampshire and Isle of Wight | 82.3 | 80.6 | 84.0 | 3.4 | 0.2 | 82.5 | 80.8 | 84.2 | 3.4 |
| UKK2 | Dorset and Somerset | 82.6 | 80.9 | 84.3 | 3.4 | −0.2 | 82.4 | 80.5 | 84.3 | 3.8 |
| UKI5 | Outer London - East and North East | 82.3 | 80.2 | 84.3 | 4.1 | 0.1 | 82.4 | 80.4 | 84.2 | 3.8 |
| UKK1 | Gloucestershire, Wiltshire and Bristol/Bath area | 82.3 | 80.6 | 84.0 | 3.4 | 0.0 | 82.3 | 80.5 | 84.1 | 3.6 |
| UKE2 | North Yorkshire | 82.5 | 80.8 | 84.1 | 3.3 | −0.2 | 82.3 | 80.5 | 84.0 | 3.5 |
| UKH1 | East Anglia | 82.4 | 80.6 | 84.1 | 3.5 | −0.1 | 82.3 | 80.4 | 84.2 | 3.8 |
| UKH2 | Bedfordshire and Hertfordshire | 82.5 | 80.8 | 84.1 | 3.3 | −0.2 | 82.3 | 80.4 | 84.1 | 3.7 |
| UKI4 | Inner London - East | 81.9 | 79.5 | 84.2 | 4.7 | 0.1 | 82.0 | 80.0 | 84.0 | 4.0 |
| UKG1 | Herefordshire, Worcestershire and Warwickshire | 82.1 | 80.0 | 84.1 | 4.1 | −0.2 | 81.9 | 80.1 | 83.6 | 3.5 |
| UKK4 | Devon | 82.0 | 80.3 | 83.7 | 3.4 | −0.1 | 81.9 | 80.0 | 83.7 | 3.7 |
| UKD6 | Cheshire | 81.9 | 80.2 | 83.5 | 3.3 | 0.0 | 81.9 | 80.0 | 83.7 | 3.7 |
| UKH3 | Essex | 81.7 | 80.2 | 83.2 | 3.0 | 0.1 | 81.8 | 80.3 | 83.3 | 3.0 |
| UKD1 | Cumbria | 81.4 | 79.7 | 83.1 | 3.4 | 0.2 | 81.6 | 79.8 | 83.3 | 3.5 |
| UKJ4 | Kent | 81.7 | 80.0 | 83.5 | 3.5 | −0.1 | 81.6 | 79.7 | 83.4 | 3.7 |
| UKF2 | Leicestershire, Rutland and Northamptonshire | 81.7 | 79.9 | 83.5 | 3.6 | −0.2 | 81.5 | 79.9 | 83.2 | 3.3 |
| UKK3 | Cornwall and Isles of Scilly | 81.7 | 80.0 | 83.4 | 3.4 | −0.3 | 81.4 | 79.5 | 83.2 | 3.7 |
| UKL2 | East Wales | 81.2 | 79.2 | 83.1 | 3.9 | −0.2 | 81.0 | 79.1 | 83.0 | 3.9 |
| UKF3 | Lincolnshire | 81.1 | 79.6 | 82.7 | 3.1 | −0.1 | 81.0 | 79.0 | 82.9 | 3.9 |
| UKF1 | Derbyshire and Nottinghamshire | 81.0 | 79.3 | 82.7 | 3.4 | −0.1 | 80.9 | 79.3 | 82.6 | 3.3 |
| UKG2 | Shropshire and Staffordshire | 81.1 | 79.5 | 82.7 | 3.2 | −0.2 | 80.9 | 79.2 | 82.6 | 3.4 |
| UKN0 | Northern Ireland | 80.6 | 78.6 | 82.6 | 4.0 | 0.3 | 80.9 | 79.1 | 82.6 | 3.5 |
| UKE1 | East Riding and North Lincolnshire | 80.2 | 78.1 | 82.3 | 4.2 | 0.6 | 80.8 | 79.0 | 82.5 | 3.5 |
| UKM5 | North Eastern Scotland | 80.4 | 78.6 | 82.2 | 3.6 | −0.1 | 80.3 | 78.3 | 82.4 | 4.1 |
| UKE3 | South Yorkshire | 80.5 | 78.7 | 82.2 | 3.5 | −0.3 | 80.2 | 78.4 | 81.9 | 3.5 |
| UKG3 | West Midlands | 80.3 | 78.2 | 82.3 | 4.1 | −0.1 | 80.2 | 78.2 | 82.2 | 4.0 |
| UKE4 | West Yorkshire | 80.4 | 78.4 | 82.2 | 3.8 | −0.3 | 80.1 | 78.3 | 82.0 | 3.7 |
| UKM6 | Highlands and Islands | 80.4 | 78.6 | 82.3 | 3.7 | −0.4 | 80.0 | 78.4 | 81.7 | 3.3 |
| UKD3 | Greater Manchester | 79.7 | 77.9 | 81.5 | 3.6 | 0.3 | 80.0 | 78.3 | 81.8 | 3.5 |
| UKL1 | West Wales and the Valleys | 80.2 | 78.3 | 82.2 | 3.9 | −0.2 | 80.0 | 78.0 | 82.0 | 4.0 |
| UKD4 | Lancashire | 79.9 | 78.0 | 81.9 | 3.9 | 0.0 | 79.9 | 78.0 | 81.7 | 3.7 |
| UKM7 | Eastern Scotland | 79.8 | 77.8 | 81.8 | 4.0 | 0.1 | 79.9 | 78.0 | 81.7 | 3.7 |
| UKC2 | Northumberland and Tyne and Wear | 80.2 | 78.3 | 82.1 | 3.8 | −0.3 | 79.9 | 77.8 | 82.0 | 4.2 |
| UKC1 | Tees Valley and Durham | 79.8 | 77.9 | 81.6 | 3.7 | 0.0 | 79.8 | 78.0 | 81.6 | 3.6 |
| UKD7 | Merseyside | 79.8 | 77.7 | 81.8 | 4.1 | −0.2 | 79.6 | 77.7 | 81.3 | 3.6 |
| UKM9 | Southern Scotland | 79.5 | 77.7 | 81.2 | 3.5 | −0.3 | 79.2 | 77.4 | 80.8 | 3.4 |
| UKM8 | West Central Scotland | 77.8 | 75.6 | 80.0 | 4.4 | 0.1 | 77.9 | 75.5 | 80.1 | 4.6 |


Charts
-
![Development of life expectancy in the United Kingdom according to estimation of the World Bank Group[6]](https://upload.wikimedia.org/wikipedia/commons/thumb/8/84/Life_expectancy_by_WBG_-United_Kingdom.png/431px-Life_expectancy_by_WBG_-United_Kingdom.png) Development of life expectancy in the United Kingdom according to estimation of the World Bank Group[6]
Development of life expectancy in the United Kingdom according to estimation of the World Bank Group[6] -
![Life expectancy with calculated sex gap[6]](https://upload.wikimedia.org/wikipedia/commons/thumb/3/32/Life_expectancy_by_WBG_-United_Kingdom_-diff.png/360px-Life_expectancy_by_WBG_-United_Kingdom_-diff.png) Life expectancy with calculated sex gap[6]
Life expectancy with calculated sex gap[6] -
![Life expectancy in comparison to prime ministers of the country[6]](https://upload.wikimedia.org/wikipedia/commons/thumb/c/c2/Life_expectancy_by_WBG_-United_Kingdom_-leader.png/352px-Life_expectancy_by_WBG_-United_Kingdom_-leader.png) Life expectancy in comparison to prime ministers of the country[6]
Life expectancy in comparison to prime ministers of the country[6] -
![Life expectancy in the United Kingdom according to estimation of Our World in Data[7]](https://upload.wikimedia.org/wikipedia/commons/thumb/e/ed/Life_expectancy_in_the_United_Kingdom.svg/319px-Life_expectancy_in_the_United_Kingdom.svg.png) Life expectancy in the United Kingdom according to estimation of Our World in Data[7]
Life expectancy in the United Kingdom according to estimation of Our World in Data[7] -
![Development of life expectancy in the United Kingdom in comparison to some big countries of the world[6]](https://upload.wikimedia.org/wikipedia/commons/thumb/f/f5/Life_expectancy_in_some_big_countries.png/355px-Life_expectancy_in_some_big_countries.png) Development of life expectancy in the United Kingdom in comparison to some big countries of the world[6]
Development of life expectancy in the United Kingdom in comparison to some big countries of the world[6] -
![Development of life expectancy in the United Kingdom in comparison to the largest by population European countries[6]](https://upload.wikimedia.org/wikipedia/commons/thumb/2/24/Life_expectancy_in_the_largest_European_countries.png/355px-Life_expectancy_in_the_largest_European_countries.png) Development of life expectancy in the United Kingdom in comparison to the largest by population European countries[6]
Development of life expectancy in the United Kingdom in comparison to the largest by population European countries[6]
![Development of life expectancy in the United Kingdom according to estimation of the World Bank Group[6]](http://oksuvcw.org/?page_id=222&rdp_we_resource=https%3A%2F%2Fen.wikipedia.org%2Fwiki%2FFile%3ALife_expectancy_by_WBG_-United_Kingdom.png)
![Life expectancy with calculated sex gap[6]](http://oksuvcw.org/?page_id=222&rdp_we_resource=https%3A%2F%2Fen.wikipedia.org%2Fwiki%2FFile%3ALife_expectancy_by_WBG_-United_Kingdom_-diff.png)
![Life expectancy in comparison to prime ministers of the country[6]](http://oksuvcw.org/?page_id=222&rdp_we_resource=https%3A%2F%2Fen.wikipedia.org%2Fwiki%2FFile%3ALife_expectancy_by_WBG_-United_Kingdom_-leader.png)
![Life expectancy in the United Kingdom according to estimation of Our World in Data[7]](http://oksuvcw.org/?page_id=222&rdp_we_resource=https%3A%2F%2Fen.wikipedia.org%2Fwiki%2FFile%3ALife_expectancy_in_the_United_Kingdom.svg)
![Development of life expectancy in the United Kingdom in comparison to some big countries of the world[6]](http://oksuvcw.org/?page_id=222&rdp_we_resource=https%3A%2F%2Fen.wikipedia.org%2Fwiki%2FFile%3ALife_expectancy_in_some_big_countries.png)
![Development of life expectancy in the United Kingdom in comparison to the largest by population European countries[6]](http://oksuvcw.org/?page_id=222&rdp_we_resource=https%3A%2F%2Fen.wikipedia.org%2Fwiki%2FFile%3ALife_expectancy_in_the_largest_European_countries.png)
-
![Life expectancy and healthy life expectancy in the United Kingdom on the background of other countries of the world in 2019[8]](https://upload.wikimedia.org/wikipedia/commons/thumb/c/c2/Healthy_life_expectancy_bar_chart_-world.png/529px-Healthy_life_expectancy_bar_chart_-world.png) Life expectancy and healthy life expectancy in the United Kingdom on the background of other countries of the world in 2019[8]
Life expectancy and healthy life expectancy in the United Kingdom on the background of other countries of the world in 2019[8] -
![Life expectancy and healthy life expectancy for males and females separately[8]](https://upload.wikimedia.org/wikipedia/commons/thumb/d/d0/Healthy_life_expectancy_bar_chart_-world_-sex.png/529px-Healthy_life_expectancy_bar_chart_-world_-sex.png) Life expectancy and healthy life expectancy for males and females separately[8]
Life expectancy and healthy life expectancy for males and females separately[8]
![Life expectancy and healthy life expectancy in the United Kingdom on the background of other countries of the world in 2019[8]](http://oksuvcw.org/?page_id=222&rdp_we_resource=https%3A%2F%2Fen.wikipedia.org%2Fwiki%2FFile%3AHealthy_life_expectancy_bar_chart_-world.png)
![Life expectancy and healthy life expectancy for males and females separately[8]](http://oksuvcw.org/?page_id=222&rdp_we_resource=https%3A%2F%2Fen.wikipedia.org%2Fwiki%2FFile%3AHealthy_life_expectancy_bar_chart_-world_-sex.png)
-
![Life expectancy and healthy life expectancy in the United Kingdom on the background of other countries of Europe in 2019[8]](https://upload.wikimedia.org/wikipedia/commons/thumb/9/93/Healthy_life_expectancy_bar_chart_-Europe.png/530px-Healthy_life_expectancy_bar_chart_-Europe.png) Life expectancy and healthy life expectancy in the United Kingdom on the background of other countries of Europe in 2019[8]
Life expectancy and healthy life expectancy in the United Kingdom on the background of other countries of Europe in 2019[8] -
![Life expectancy and healthy life expectancy for males and females separately[8]](https://upload.wikimedia.org/wikipedia/commons/thumb/1/13/Healthy_life_expectancy_bar_chart_-Europe_-sex.png/530px-Healthy_life_expectancy_bar_chart_-Europe_-sex.png) Life expectancy and healthy life expectancy for males and females separately[8]
Life expectancy and healthy life expectancy for males and females separately[8]
![Life expectancy and healthy life expectancy in the United Kingdom on the background of other countries of Europe in 2019[8]](http://oksuvcw.org/?page_id=222&rdp_we_resource=https%3A%2F%2Fen.wikipedia.org%2Fwiki%2FFile%3AHealthy_life_expectancy_bar_chart_-Europe.png)
![Life expectancy and healthy life expectancy for males and females separately[8]](http://oksuvcw.org/?page_id=222&rdp_we_resource=https%3A%2F%2Fen.wikipedia.org%2Fwiki%2FFile%3AHealthy_life_expectancy_bar_chart_-Europe_-sex.png)
See also
References
- ^ "Life expectancy for local areas of the UK: between 2001 to 2003 and 2017 to 2019". Office for National Statistics. 2020-09-24. Retrieved 24 February 2024. — section 2. Subnational life expectancy
- ^ "Life expectancy for local areas in England, Northern Ireland and Wales: between 2001 to 2003 and 2020 to 2022". Office for National Statistics. 2024-01-26. Retrieved 24 February 2024. — section 2. Period life expectancy estimates in constituent countries and English regions: 2020 to 2022. Figure 1 data.
- ^ "National life tables – life expectancy in the UK: 2020 to 2022". Office for National Statistics. 2024-01-11. Retrieved 24 February 2024. — section 3. Life expectancy at birth in UK countries
- ^ a b c "Life expectancy at birth by sex and NUTS 2 region". Eurostat. 22 December 2023. Retrieved 24 February 2024. — Dataset
- ^ a b c "Life expectancy at birth by sex and NUTS 2 region". Eurostat. 22 December 2023. Retrieved 24 February 2024. — Table. For visualization use tab "Map"
- ^ a b c d e "Life expectancy at birth, total - United Kingdom". World Bank Group.
- ^ "Life expectancy at birth: United Kingdom". Our World in Data.
- ^ a b c d "Life expectancy and Healthy life expectancy, data by country". World Health Organization. 2020. Retrieved 24 February 2024.